

Metal AM at Euro pm2015:
EBM for aerospace and automotive, powder recycling, and advances in SLM
For readers who have not yet discovered the annual conference of the European Powder Metallurgy Association (EPMA), the Euro PM conference series has grown to become a rich source of technical information on the latest advances in powder-based metal AM. The Euro PM2015 Congress, held in Reims, France, 4-7 October 2015, was no exception and Dr David Whittaker reports on a number of key technical presentations made during the first two Additive Manufacturing sessions at the congress. [First published in Metal AM Vol. 1 No. 4, Winter 2015 | 35 minute read | View on Issuu | Download PDF]
![Fig. 1 Typical microstructure of EBM produced Ti-6Al-4V component with 35 mm diameter (image from centre point) [1]](http://www.metal-am.com/wp-content/uploads/sites/4/2015/12/01-1024x759.jpg)
Mechanical properties of Ti-6Al-4V manufactured via Electron Beam Melting
The Electron Beam Melting session was opened with one of the six nominated keynote papers in the conference, presented by Thays Machry (Airbus Group, UK) and co-authored by David Eatock and Jonathan Meyer (also Airbus Group), Alphons Antonysamy (GKN Aerospace, UK) and Alistair Ho and Phil Prangnell (The Manchester University, UK). This paper considered the effect of part geometry on the microstructure and consequent mechanical properties of Ti-6Al-4V specimens manufactured by Electron Beam Melting (EBM).
The Additive Manufacturing research team at Airbus Group is evaluating the manufacture of Ti-6Al-4V parts via EBM technology with a view to production of flight hardware. Compared with other metal AM processes, EBM offers a high building speed and higher level of geometric freedom. The higher level of geometric freedom is obtained due to pre-heating (to around 730°C) the loose powder deposited after each layer, thus creating an annealing effect and eliminating the residual stresses generated during the process.

During the EBM process, the material microstructure can be influenced by several process parameters, such as heat in the chamber, height of the build (Z-height), build packing density and beam scanning velocity. Additionally, the heat dissipation during the build is another important factor that influences the material microstructure. In this case, the microstructures of thick and thin components would be different, as well as the microstructures from short and taller components. Therefore, this study has investigated the influence of component size on the mechanical performance and microstructure of Ti-6Al-4V cylinders, as well as the influence of build height on component tensile strength.
Pure titanium is an allotropic element, which adopts more than one crystal structure with a change in temperature. At room temperature, pure Ti transforms into a hexagonal closed packed (HCP) form, known as α-phase. At high temperatures above 882°C, Ti exists in a body centre cubic (BCC) form, known as β-phase until reaching the melting temperature of about 1670°C, which is also known as the ß transus temperature. Titanium can be alloyed with elements categorised as stabilisers, known as α or ß stabilisers. These stabilisers influence certain characteristics of the material such as altering the α → ß transition temperature of titanium (882°C). Ti-6Al-4V is a type of α + ß stabiliser containing a combination of α and ß stabilising phases at room temperature.

The bulk microstructure of Ti-6Al-4V produced in EBM is made up of columnar prior ß grains delineated by grain boundary α. In addition, within the prior ß grains, a transformed α + ß microstructure with both α-colony and Widmanstätten morphology is apparent. Fig. 1 shows an image taken with an optical microscope of one of the specimens from this study. The grain growth on solidification is controlled by what happens at the melt pool surface. Grains generally grow normal to the melt pool surface. Columnar growth in the build direction is due to the effect of adding many layers and orthogonal rastering.
Existing literature shows a variation of microstructure depending on specimen thickness. In this reported study, samples were produced with a thick base on which thinner section walls were built using the EBM process. Fig. 2 shows the cross sections parallel to the build direction of reconstructed ß grain structures through the transition from a wide base to vertical walls measuring 1 to 5 mm in thickness. Fig. 2(a) shows an original α phase map and (b) to (e) show reconstructed ß grain structures for 1 mm, 1.5 mm, 2 mm and 5 mm walls. On the right side of each is a plan view taken half-way up the vertical walls. It is clear that the geometry of the component influences the grain size formation during build lay-up.
![Fig. 2 EBSM maps of vertical cross sections from samples with different wall thicknesses (made with Ti-6Al-4V EBM), (a) shows an original α phase map and (b) to (e) shows reconstructed ß grain structures for 1 mm, 1.5 mm, 2 mm and 5 mm wall [1]](http://www.metal-am.com/wp-content/uploads/sites/4/2015/12/02-1024x934.jpg)
In the study, specimens were manufactured by EBM using an Arcam A2 machine. Plasma atomised Ti-6Al-4V powder was used to manufacture all specimens. A total of 27 round specimens with nine different component thicknesses were produced. The cylinders were built with 80 mm height. Table 1 summarises the specimens and Fig. 3 shows how the specimens were arranged and built. Three specimens of each diameter were built on the top of one another. These specimens were referred to throughout the work as bottom (closer to build plate), middle and top. All specimens subsequently went through the same cycle of Hot Isostatic Pressing (HIP) at 920°C for two hours at 102 MPa pressure.
![Table 1 Experimental Ti-6A-l4V specimens manufactured for tensile and microstructural analyses [1]](http://www.metal-am.com/wp-content/uploads/sites/4/2015/12/t01-794x1024.jpg)
![Fig. 3 Arrangement of specimens in build platform from Arcam A2 machine [1]](http://www.metal-am.com/wp-content/uploads/sites/4/2015/12/03-894x1024.jpg)
As a first step in the study, the influence of different specimen diameters was investigated. Table 2 shows the average of the results from the samples in the bottom, middle and top of the build in terms of Z-height.
![[*] One specimen failed prematurely and had to be discarded for the analysis [**] One result was identified as anomaly and was not included in the analysis Table 2 Results from tensile test performed on Ti-6Al-4V specimens [1]](http://www.metal-am.com/wp-content/uploads/sites/4/2015/12/t02-1024x652.jpg)
[**] One result was identified as anomaly and was not included in the analysis
Table 2 Results from tensile test performed on Ti-6Al-4V specimens [1]
A considerable variation in the proof stress and ultimate tensile strength (UTS) was present. It appeared that, as the component thickness increased, the tensile strength was greater (Fig. 4). The error bars refer to the standard deviation of the results and the trend line plotted shows a R2 value of approximately 0.94 for 0.2%PS and 0.93 for UTS. The component with 40 mm diameter shows an increase of 5% in proof stress and UTS in comparison with the component with 6 mm. The remaining properties (elongation, reduction of area and Young Modulus) were found not to be significantly influenced by component thickness.
![Fig. 4 Proof stress and ultimate tensile strength plotted against component thickness [1]](http://www.metal-am.com/wp-content/uploads/sites/4/2015/12/04-1024x533.jpg)
The influence of build height on the strength of the samples was analysed. Figs. 5 and 6 show the 0.2% PS and UTS plotted for the samples at bottom (1), middle (2) and top (3) of the build plate. It can be observed that, close to the build plate, there is a small variation of strength, independent of component thickness. As the build in Z-height grows, the difference in strength diverges and, at the top of the build, it is possible to identify a decrease in strength in the smaller (6 and 10 mm) diameter components. In contrast, components with 18, 22, 30 and 35 mm diameter show a slight increase in the strength along the build Z-height.
![Fig. 5 Proof stress plotted versus the build height for Ti-6Al-4V component thickness [1]](http://www.metal-am.com/wp-content/uploads/sites/4/2015/12/05-1024x626.jpg)
Typically there are two factors that influence the alpha-beta transformation and, consequently, mechanical properties of specimens built using EBM. These are the thermal conductivity (or cooling rate) and the accumulated heating (time at temperature). Based on several pieces of experimental research on EBM, it is believed that the lower scatter in the strength of the specimens in contact with the build plate might be an influence of the effectiveness of the heat dissipation throughout the metal start plate. This causes the component to thermally conduct the heat away predominantly into the plate and, consequently, affects the microstructure and mechanical properties. As the build grows in the Z-height, the heat flux and accumulated heating changes, depending on the specimen geometry.
![Fig. 6 Ultimate tensile strength plotted versus the build height for Ti-6Al-4V components [1]](http://www.metal-am.com/wp-content/uploads/sites/4/2015/12/06-1024x629.jpg)
In the thinner samples, where a decrease in strength is seen, the conduction of the heat deposited along the build is less as a smaller area is in contact with the plate. In the thicker samples, heat is conducted downwards in the direction of the build plate more efficiently due to the higher contact area with the build plate. As the melted area in a layer increases, a radial thermal conductivity from core to surface also exists. This also influences the formation of the alpha plates and spheroidisation of beta phase, leading to an increase in strength and decrease in standard deviation as observed in Fig. 4. Interestingly, the samples in the middle showed a slight decrease in strength (Figs. 5 and 6). The samples on the top, when completed, start dissipating heat not only through the melted material, but also through radiation at the top surface. In this case, the middle sample will stay longer at high temperatures and cool down more slowly than the top and bottom specimens. Hence, coarse grains will be formed and a slight decrease in strength observed.
In terms of microstructure, the α-colony size is important in determining the mechanical properties of Ti-6Al-4V alloys. Decreasing the α-colony size improves the performance of the titanium alloy, such as ultimate strength, yield strength, ductility and crack propagation resistance. In the metallographic analyses reported in this study, the α-plate spacing was measured for each component because it is a suitable representation of the α-colony size. For the α-plate spacing measurements, SEM images were taken at random locations on each specimen and image correlation was used. The technique used to measure the α-plate spacing was developed at the University of Manchester. Fig. 7a shows a typical SEM image taken from a 6 mm component. The shades of grey/ black areas are the α-phase plates, whilst areas surrounding the α-phase are the discontinuous β-phase. The image is then enhanced using dynamic background correction so that α and β-phases can be distinguished (Fig. 7b). The image is then differentiated to detect greyscale gradient peaks in the images and thus effectively detect the phase boundaries between α and β phases to outline the boundaries of the phases (Fig. 7c). The linear intercept method was then used to determine the alpha plate spacing from the digitised phase boundary image (Fig. 7d).
![Fig. 7 Process of measuring the α-plate spacing from an original SEM image (a), to threshold image distinguishing α and β phases (b), edged image to outline phase boundaries (c) and use of linear intercept method to determine α-plate spacing (d) [1]](http://www.metal-am.com/wp-content/uploads/sites/4/2015/12/07-1024x800.jpg)
The values measured on the components are graphically shown in Fig. 8. A decrease in α-plate spacing was observed with the increase in component thickness. The presence of finer α-plates in thicker components can be attributed to a more efficient cooling of the component during the build, where higher cooling rates will result in better mechanical performance.
![Fig. 8 Alpha plate spacing plotted versus component thickness [1]](http://www.metal-am.com/wp-content/uploads/sites/4/2015/12/08-1024x607.jpg)
Titanium aluminides for automotive applications
A paper in the EBM session from Giorgio Baudana, Sara Biamino, Paolo Fino and Claudio Badini (Politecnico di Torino, Italy), Burghart Kloden (Fraunhofer IFAM, Dresden, Germany) and Anita Buxton (TWI Ltd., UK) addressed the processing by EBM of titanium aluminides for automotive applications.
γ-TiAl is an important class of structural materials, which, because of the excellent physical and mechanical properties, plays an important role in the aerospace and automotive industries. In particular, these aluminides are considered an attractive alternative to nickel-based superalloys due to a lower density (around 4 g/cm3 for γ-TiAl alloys and 8 g/cm3 for Ni-based superalloys). In this reported work, carried under the aegis of a European project TIALCHARGER, TiAl-based powders, Ti-48Al-2Cr-2Nb (48-2-2) and Ti-48Al-2Nb-0.7Cr-0.3Si (RNT650), were used to fabricate specimens and prototypes of hollow turbocharger turbines by Electron Beam Melting (EBM).
The TiAl powders were produced by gas atomisation and had particle sizes between 45 and 150 μm. Test samples (Fig. 9a) and test turbocharger wheels (Fig. 9b) were produced using an Arcam A2X EBM machine, with a layer thickness of 70 μm. Fig. 9c shows a sample used for the evaluation of joining by brazing. The test samples made from alloy Ti-48Al-2Cr-2Nb (48-2-2) were found to be fully densified with only a minor amount of build flaws.
![Fig. 9 (a) RNT650 EBM test samples, (b) EBM turbocharger wheel, (c) Joining trial [2]](http://www.metal-am.com/wp-content/uploads/sites/4/2015/12/09-1024x495.jpg)
The chemical composition of the specimens was analysed and compared with the chemical composition of the starting powder. The results are shown in Table 3. The observed loss of Al was in the range of 1.4 wt% (comparable with data from the literature), while the impurity contents are comparable between the powder and the part (indicating the cleanliness of the process).
![Table 3 Chemical composition of powder and specimens [2]](http://www.metal-am.com/wp-content/uploads/sites/4/2015/12/t03-1024x144.jpg)
The microstructures in the as-EBM and heat-treated states were examined. Directly after EBM, the microstructure consisted of equiaxed coarse and fine grains (Fig. 10a). An additional heat treatment (1350°C for 2 hours) homogenised the microstructure to a fully lamellar type (Fig. 10b).
![Fig. 10 (a) Microstructure of the specimen post EBM, (b) microstructure post heat treatment [2]](http://www.metal-am.com/wp-content/uploads/sites/4/2015/12/10-1024x429.jpg)
Test samples of alloy Ti-48Al-2Nb-0.7Cr-0.3Si (RNT650) and hollow turbocharger wheel prototypes (Fig. 11) were produced. These samples were fully densified. The chemical composition of the specimens was analysed and compared with powder chemical composition and a reference RNT650 material produced by casting. The results are shown in Table 4. A 2-3% aluminium loss was detected from powder to specimen during EBM, giving a specimen with a chemical composition that matches extremely well with the reference casting part.
![Table 4 Chemical compositions of RNT650 powder, samples produced by EBM and casting reference sample [2]](http://www.metal-am.com/wp-content/uploads/sites/4/2015/12/t04-1024x329.jpg)
![Fig. 11 Turbocharger prototypes: sample placement within build chamber with different support structures [2]](http://www.metal-am.com/wp-content/uploads/sites/4/2015/12/11-1024x687.jpg)
Similarly to alloy Ti-48Al-2Cr-2Nb, the microstructure after EBM consisted of equiaxed coarse and fine grains (Fig. 12a). After a heat treatment at 1355°C for 1 hour, a near lamellar microstructure was obtained. The RNT650 material produced by EBM was subjected to X-ray diffraction analysis and the identified phases were the main γ-TiAl phase and traces of α2-Ti3Al phase as for the 48-2-2 alloy (Fig. 12b).
![Fig. 12 (a) microstructure as-EBM of the RNT650 alloy, (b) X-Ray spectrum of the RNT650 alloy as-EBM [2]](http://www.metal-am.com/wp-content/uploads/sites/4/2015/12/12-1024x311.jpg)
The scheme for the reported joining (brazing) trials is shown in Fig. 13a. Figs. 13b and 13c to 13h show SEM and elemental distribution maps at the triple joint TiAl-Ni-steel. The characterisation highlights a good adhesion between TiAl, the Ni alloy and the steel. As regards element distribution, it was possible to observe that iron from the steel diffuses into the Ni layer and, in a similar way (but at a lower level), titanium from the TiAl also diffuses into the Ni layer.
The level of adhesion shown in these joining trials is regarded as being very promising for the application.
![Fig. 13 (a) Joining trial scheme (section), (b) FE-SEM image at 5000 x magnification of the EDS elemental mapping area, from (c) to (H) EDS elemental maps [2]](http://www.metal-am.com/wp-content/uploads/sites/4/2015/12/13-1024x848.jpg)
Recycling of metal powders in the Additive Manufacturing process
In the session on Properties and Failure Analysis a paper by D Novotnak and L Lherbier (Carpenter Powder Products, USA) addressed the important issue of the impact of recycling AM powders. Most iron, nickel and cobalt based AM alloys are argon or nitrogen atomised. The gas atomisation process, whether using freefall or close coupled technology, produces a wide range of powder particle sizes. The restrictive nature of powder bed AM processes requires screening of atomised powder to a narrow particle size distribution (PSD). Resultant yields can be low, depending on the alloy, and consequent pricing high. Since powder bed processes require substantial amounts of powder not used to manufacture components, many end-users are recycling the powder. The overall effect of recycling powder on quality is not well known. However, recent studies on recycled powder have shown effects on PSDs and oxygen levels in the powder.
The purpose of this paper was to discuss the effect of recycling these powders many times, both on the powder itself and the ultimate quality of the component. The nominal compositions of the powders studied in this work are given in Table 5.
![Table 5 Nominal compositions of the AM grades in the study [3]](http://www.metal-am.com/wp-content/uploads/sites/4/2015/12/t05-1024x230.jpg)
To produce satisfactory AM components, basic powder requirements, as illustrated in Fig. 14, include chemistry, particle size distribution, morphology and flow properties and cleanliness. Among all the realities of manufacturing a quality powder, cleanliness may be the most critical in determining final part quality. The powder user, independent of which machine is being used to manufacture the AM component, must maintain clean powder containers, limit airborne contaminants and avoid cross contamination with other alloys. While the factors listed above for manufacturing quality components are necessary and required, the focus of this reported work was to point out potential issues associated with the use of recycled powders for the AM bed processes.
![Fig. 14 Basic powder requirements for Additive Manufacturing [3]](http://www.metal-am.com/wp-content/uploads/sites/4/2015/12/14-1024x409.jpg)
Examination of recycled stainless steel powder (Fig. 15) shows a reduction in the number of fine particles in the powder. A more important issue, however, may be the number of oxidised particles observed in powders that were recycled many times. Oxygen analyses of the two powders showed an increase from 320 ppm in the virgin material to 830 ppm in the recycled powder.
![Fig. 15 PSD and visual changes from powder cycling [3]](http://www.metal-am.com/wp-content/uploads/sites/4/2015/12/15-1024x464.jpg)
A similar analysis was conducted on the F75 CoCr alloy. Again, as shown in Fig. 16, a loss of fines was observed after recycling ten times. The oxygen level increased from 260 ppm to 384 ppm. Oxidised particles were clearly visible in the recycled powder. Evaluation of the same powder recycled 30 times showed an increase in oxygen level to 568 ppm. Consolidation of the powders recycled 10 times and 30 times, as illustrated in Fig. 17, shows an increased amount of oxidised particles in the microstructure with increased recycling.
![Fig. 16 PSD and visual changes from powder recycling [3]](http://www.metal-am.com/wp-content/uploads/sites/4/2015/12/16-1024x511.jpg)
![Fig. 17 Metallographic comparison of F75 at 10x and 30x recycled powder [3]](http://www.metal-am.com/wp-content/uploads/sites/4/2015/12/17-1024x375.jpg)
Additional work remains to be done on the effect of the oxidised particles on mechanical properties and to determine the number of times a powder can be safely recycled. Initial results indicate that oxygen pick-up is affected by the chemical composition of AM alloy powder types. The latest study has focussed on the use of recycled powders in making a DMLS test bar with different sections from recycled powder, virgin powder and a blended powder of recycled and virgin powder. A comparison of the test bar sections is shown in Fig. 18. Although the expected oxidised particles were present in the test bars, an unexpected porosity difference was also observed in the microstructures. The virgin powder section showed the least porosity followed by the blended powder (virgin plus recycled) and then by the recycled. The results would indicate the need for subsequent consolidation by hot isostatic pressing in order to produce the highest quality component.
![Fig. 18 Influence of recycled powder on porosity [3]](http://www.metal-am.com/wp-content/uploads/sites/4/2015/12/18-1024x280.jpg)
Modelling of short crack initiation in Selective Laser Melting
The next paper came from Tom Andersson, Anssi Laukkanen, Tatu Pinomaa, Antero Jokinen, Antii Vaajoki and Tarja Laitinen (VTT Technical Centre of Finland Ltd, Finland) and addressed the mesoscale modelling of short crack initiation in metallic microstructures created by Selective Laser Melting (SLM).
Selective Laser Melting is a versatile AM manufacturing method that has found extensive use in rapid prototyping. A significant issue for the increased use of SLM is the technology’s utilisation in key components with high performance requirements. For example, in the aerospace sector, the use of SLM in rotating components operating at elevated temperatures imposes an essential requirement for the parts to be defect free. However, in practice, such material microstructures have proven to be difficult to achieve and issues with process consistency in complex part designs make such efforts ever more challenging.
In order to address this issue, this paper presented a material defect structure based modelling methodology for the evaluation of the significance of individual microstructure-scale defects in influencing the operating time required for the initiation of short fatigue cracks. The first step in this analytical method was the capture, from scanning electron micrographs (SEM), of information on manufacturing defects in AM specimens, such as pores, cracks, various clusters and interface defects between laser melted layers.
Input information on residual stresses is also significant in material lifetime prediction. Generally, it is almost impossible to determine residual stresses without destroying the component. To determine residual stress level, whilst still keeping the component intact, it is necessary to model the SLM process. A simplified process model for SLM to predict the residual stress-strain state of the component has been used. A thermomechanical process model for SLM is presented in Fig. 19. This process model has been combined with an image-based microstructural model of the defect structure, in order to establish the link between microstructural defects and fatigue performance. The various identified defect shapes and types in the microstructure have been modelled using image-based FEM under uniaxial tension. The method makes the evaluation of the significance of different defect types and sizes possible. Their significance, with respect to Fatigue Performance Indicators (FPIs), can be extracted.
![Fig. 19 Temperature isosurfaces during the simulation of the final layer and 1st principal and equivalent stresses [4]](http://www.metal-am.com/wp-content/uploads/sites/4/2015/12/19-1024x915.jpg)
The procedure for image-based microstructure modelling is presented in Fig. 20. The Fatemi-Socie (F-S) parameter was used in the subsequent evaluations. FPIs provide a quantitative estimate of the relation between microstructural stress-strain states and fatigue initiation life and therefore assess the criticality of specific microstructural features with respect to defect initiation. FPIs enable the linking of individual microstructural defects and the respective fatigue initiation lifetime estimates, thus quantifying the significance of microstructural defects and their interactions throughout the microstructure. The effects of defect type in three analysed microstructures are presented in the Coffin-Manson curves in Fig. 21.
![Fig. 20 Modelling procedure from upper left to lower right: microstructure, defect structure, equivalent stress and strain contours [4]](http://www.metal-am.com/wp-content/uploads/sites/4/2015/12/20-1024x639.jpg)
![Fig. 21 The effect of defect type on lifetime prediction [4]](http://www.metal-am.com/wp-content/uploads/sites/4/2015/12/21-558x1024.jpg)
The effect of residual stress in a selected case is presented in Fig. 22. Three different residual stress levels have been introduced. The analysis of the worst case (circled in upper image) is shown in the lower image of Fig. 22.
![Fig. 22 Effect of residual stress (upper without, lower with residual stress) [4]](http://www.metal-am.com/wp-content/uploads/sites/4/2015/12/22-826x1024.jpg)
Processing parameters and chemical composition of tool steels
The final contribution to this session remained with the SLM process. This paper, from J Lemke, R Casati, A Demir, B Previtali and M Vedani (Politecnico di Milano, Italy) and C Andrianopoli and M Massazza (Cogne Acciai Speciali SpA, Italy), considered the effects of processing parameters and chemical composition of tool steels on the integrity and properties of low-thickness parts.
The aim of the reported research work was to present the first step in the development of new hypereutectic tool steels available for SLM processes. A modified stainless steel of the 304 series, featuring the addition of large amounts of C and B and designated as 304CS, was considered to create a hypereutectic hard and corrosion resistant alloy with an expected strong performance under severe service conditions. It was thought that processing of such alloys might bring difficulties related to the brittleness of the primary hard phases and to the risk of oxidation of the alloying elements.
To compare the alloy properties after SLM with those achieved after conventional production methods, samples of the same feedstock alloy have been cast in an alumina crucible and changes in microstructure and hardness were evaluated. As a final step, a 316L stainless steel was processed by the same methods to add further comparison issues to the research results. 316L stainless steel is one of the most widely studied materials with the SLM process and therefore provides a good benchmark.
The compositions of the two stainless steels were as quoted in Table 6. Reference samples of the two alloys were cast in alumina crucibles under argon atmosphere and transverse cross sections of these castings were cut and prepared for microstructural investigations. A prototype powder bed device was employed for the laboratory-based selective laser melting tests on the two powders. This device was composed of a multimode continuous wave active fibre laser, coupled to a scanner head.
![Table 6 The main alloying elements in 304 CS and 316L steel (mass%) [5]](http://www.metal-am.com/wp-content/uploads/sites/4/2015/12/t06-1024x215.jpg)
A parametric study of the selective laser melting of 304CS was conducted. After preliminary tests, three power levels between 120 W and 200 W and four levels of scan speeds between 70 and 170 mm/s were adopted. On the other hand, hatch spacing, layer thickness and focus were kept fixed. The details of the processing parameters are shown in Table 7.
![Table 7 Details of the experimental plan applied in the study of Selective Laser Melting of 304 CS powder [5]](http://www.metal-am.com/wp-content/uploads/sites/4/2015/12/t07-1024x545.jpg)
Representative micrographs of 304CS in the cast form are shown in Fig. 23. The hypereutectic microstructure consisted of many primary hard carbides/borides, which could reach sizes as large as the mm range, as shown in Fig. 23a. At higher magnification (Fig. 23b), smaller carbides/borides and the eutectic constituents could be clearly identified. Black graphite flakes were also present in the alloy, owing to relatively slow solidification and cooling rates experienced by the cast samples.
![Fig. 23 Microstructure of 304 CS cast in alumina crucible [5]](http://www.metal-am.com/wp-content/uploads/sites/4/2015/12/23-1024x367.jpg)
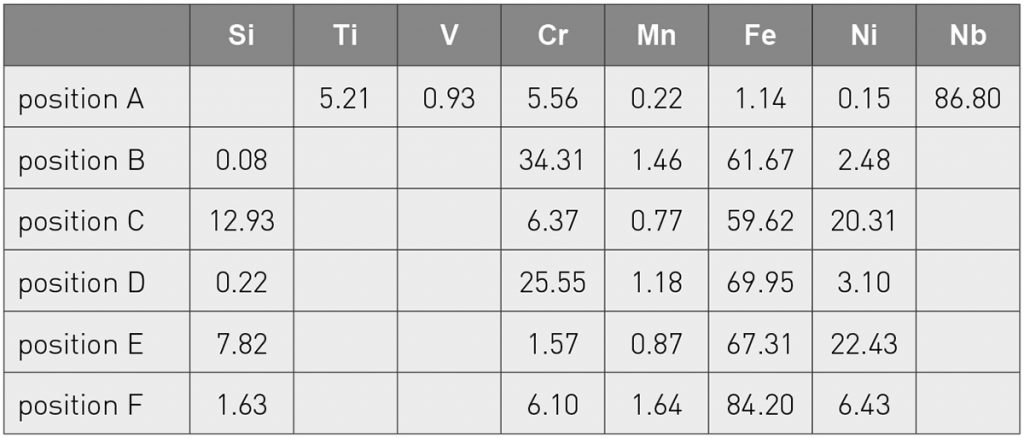
Accurate SEM and EDX analyses were used to identify the amounts of the different phases found. Local elemental concentrations are reported in Table 8. Carbides and borides of different shapes and compositions were identified. The highest fraction consisted of coarse Cr-rich carbides/borides with a rectangular shape and a size ranging from a few microns up to the millimetre scale. The eutectic constituent, which formed between the primary carbides/borides, was rich in Ni and Si. Also, at the boundaries of the coarse primary phases, small carbides/borides were found with high amounts of Nb, Ti or Ni.
Low thickness parts of 304 CS were processed next by SLM, with a power of 150 W or 120 W at different scan rates. The samples were found to be well bonded to the substrate. However, particularly for the highest scan rates, large surface cracks were observed. The microstructures of the samples were examined and classified, on the basis of the amounts of defects, namely porosity and cracks, into four levels (4 being the best level and 1 the worst). Level 4 is characterised by large defect-free areas, some macroscopic surface cracks and a few zones of small pores in the low micron range. In level 3, a few micro cracks and also some large voids with dimensions over 100 μm were present, while large areas were dense without defects. The microstructures of samples classified as level 2 were full of pores and also macroscopic and microscopic cracks, but some defect free areas could also be found. Level 1 is characterised by a consistently imperfect microstructure. An analysis, relating the achieved quality to the selected scan parameters, is shown in Table 9. At low power levels and high scanning rates, the samples showed many defects.
![Table 9 Laser scan parameters vs. achieved quality of build volume. Darker shades of colour indicate higher quality levels regarding the number and size of defects [5]](http://www.metal-am.com/wp-content/uploads/sites/4/2015/12/t09-1024x248.jpg)
In comparison to the microstructure of the cast sample, the 304CS, processed by SLM, featured a much finer microstructure. Representative optical and SEM micrographs are shown in Fig. 24. The microstructure consisted of small, sharp carbides in the 2 – 3 μm size range in a eutectic matrix. No substantial difference in microstructure was noted between the feeding and transverse directions. The cast microstructure of the 316L stainless steel was characterised by austenitic grains (Fig. 25a) and a few pores. On the other hand, the 316L structure generated by SLM processing consisted of austenite cellular colonies, with a size smaller by a factor of 100 than the cast grain structure. Compared to 304CS, the microstructure was more homogenous due to the absence of hard and brittle carbides, making it also less prone to cracking. Again, no substantial difference in microstructure was noted between the feeding and transverse directions.
![Fig. 24 Representative microstructure of 304 CS produced by SLM shown along the feeding direction (a) optical micrograph; (b) SEM micrograph [5]](http://www.metal-am.com/wp-content/uploads/sites/4/2015/12/24-1024x405.jpg)
![Fig. 25 Representative microstructures of austenitic 316L; (a) optical micrograph of cast 316L; (b) SEM micrograph of 316L steel along the feeding direction produced by SLM [5]](http://www.metal-am.com/wp-content/uploads/sites/4/2015/12/25-1024x407.jpg)
Hardness and microhardness measurements were performed on the investigated alloys. The results are shown in Table 10. While the hardness of the austenitic 316L steel increased slightly when moving from cast to SLM processed samples due to grain refinement, the increase in hardness of the SLM 304CS alloy was very high. The size reduction of carbides/borides from the millimetre scale to the micron size induces a dramatic increase in hardness.
![Table 10 Hardness of 304 CS and 316L samples, cast and SLM processed [5]](http://www.metal-am.com/wp-content/uploads/sites/4/2015/12/t10-1024x175.jpg)
The authors concluded by stating that further investigations are still required to find the optimum build parameters to reduce the number of pores and cracks, but that the results to date strongly suggest that the alloy could be used with further optimisation for AM.
Author
David Whittaker
DW Associates
231 Coalway Road, Wolverhampton
WV3 7NG, United Kingdom
Tel: +44 (0)1902 338498
Email: [email protected]
References
[1] T Machry, D Eatock, J Meyer, A Antonysamy, A Ho and P Prangnell, Effect of Microstructure on the Tensile Strength of Ti6Al4V Specimens Manufactured using Additive Manufacturing Electron Beam Process, , as presented at Euro PM2015, Reims, France, October 4-7 2015.
[2] G Baudana, S Biamino, P Fino, C Badini, B Kloden, A Buxton, Titanium aluminides for automotive applications processed by Electron Beam Melting, as presented at Euro PM2015, Reims, France, October 4-7 2015.
[3] D Novotnak and L Lherbier, The Impact of Recycling AM Powders, as presented at Euro PM2015, Reims, France, October 4-7 2015.
[4] T Andersson, A Laukkanen, T Pinomaa, A Jokinen, A Vaajoki and T Laitinen, Mesoscale Modelling of Short Crack Initiation in Metallic Selective Laser Melting Microstructures, as presented at Euro PM2015, Reims, France, October 4-7 2015.
[5] J Lemke, R Casati, A Demir, B Prevital, M Vedani, C Andrianopoli and M Massa, Effect of Processing Parameters and Chemical Composition of Tool Steels on Integrity and Properties of Low-Thickness Part Produced by Selective Laser Melting, as presented at Euro PM2015, Reims, France, October 4-7 2015.
![Fig. 1 Typical microstructure of EBM produced Ti-6Al-4V component with 35 mm diameter (image from centre point) [1]](https://www.metal-am.com/wp-content/uploads/sites/4/2015/12/01.jpg)
LAST MONTH’S MOST-READ ARTICLES