

Additive Manufacturing at World PM2016: Extending the range of materials in Powder Bed Fusion AM
Within the technical sessions dedicated to Additive Manufacturing research at the World PM2016 Congress a number of papers focused on materials new to Powder Bed Fusion and assessed the ability to process these materials. Dr David Whittaker reviews three papers that report on investigations into Inconel 625 superalloy produced by EBM, Metal Matrix Composites with ceramic reinforcement and the direct metal printing of zinc. [First published in Metal AM Vol. 3 No. 1, Spring 2017 | 20 minute read | View on Issuu | Download PDF]
Additive Manufacturing of Inconel 625 superalloy produced by Electron Beam Melting
The first paper selected for review in this article came from Edouard Chauvet, Guilhem Martin, Jean-Jacques Blandin and Remy Dendievel (SIMAP, Grenoble, France) and Benjamin Vayre and Stephane Abed (PolyShape, France) and considered the processing of the nickel-based superalloy, Inconel 625, using Electron Beam Melting (EBM) technology. The authors stated that an increasing demand has emerged from the automotive and aerospace industries to investigate the production of Ni-base superalloy parts using EBM technology. To date, the few reported studies have focussed on microstructure/mechanical property relationships in EBM-processed superalloys, rather than the processing parameters required to produce parts. The reported work was therefore aimed at addressing this shortcoming.
![Table 1 Chemical composition in wt.% of the Inconel 625 initial powder [1]](http://www.metal-am.com/wp-content/uploads/sites/4/2022/07/t01-1-1024x119.jpg)
The Inconel 625 powder used in the study was a pre-alloyed material with the nominal chemical composition shown in Table 1 and was produced by argon gas atomisation. Scanning Electron Microscopy (SEM) studies identified that this powder exhibited mainly spherical particles. However, some particle aggregation and satelliting was also noted. The mean particle density was measured by pycnometry and was found to be equal to 8.26 ± 0.17 g/cm3. The Inconel 625 density, as reported in the literature, was 8.44 g/cm3 and this was used as a reference density for subsequent comparisons. The particles size distribution, as determined by laser granulometry, ranged between 40 and 100 μm. A dendritic microstructure was observed within the particles and also some spherical pores were noted within some of the particles. The authors identified these spherical pores as being entrapped gas from the atomisation process. Entrapped gas pores were observed in about 6% of the powder particles and represented 0.45% porosity in the initial powder.

EBM samples were fabricated using an Arcam A1 system with a building temperature of 900°C. Cube shaped samples (23 x 23 x 25 mm) were produced. The DOE (Design of Experiment) approach was used to determine the optimum set of parameters. In the melting step, three parameters were varied: speed function (scan speed), beam current and focus offset. The speed function was varied from 20 to 200 (corresponding to a scan speed between 300 and 4500 mm/s), the focus offset was varied from 0 to 50 mA and the beam intensity from 2 to 20 mA. These three parameters were chosen in order to investigate the effects of beam power, beam spot size and melting time. The pre-heating conditions and scanning strategies were kept constant and the line offset between two scan lines was set at 100 μm.
The built samples showed that different melting parameters led to different top surface morphologies. Based on the top surface morphology, the different samples were classified in three categories (Fig. 2). The porous samples exhibited a porous top surface due to insufficient melting (Fig. 2a). This insufficient melting was attributed to a lack of energy to melt the successive powder layers. The over-melted samples showed a top surface with a high degree of waviness (Fig. 2c). The unevenness results from the melt pool motion caused by higher beam power leading to higher temperature gradients and surface energy effects. Samples presenting a relatively flat top surface without significant defects were denoted as being well-melted (Fig. 2b).
![Fig. 2 Typical top surface views of samples fabricated by EBM using the DOE approach: (a) Typical surface view of a porous sample, (b) a Well-Melted sample and (c) an Over-Melted sample [1]](http://www.metal-am.com/wp-content/uploads/sites/4/2022/07/02-4-1024x406.jpg)
A map of sample surface quality was plotted as a function of two processing parameters: the Speed Function (proportional to the beam scan speed) and the Focus Offset (related to the beam spot size). For these experiments, a constant Beam Intensity equal to 8 mA was used. Relative densities of the samples were plotted as a function of both Speed Function and Focus Offset. It can be seen from Fig. 3 that a higher scan speed and a larger spot size lead to a lower relative density.
![Fig. 3 Surface response based on the relative density obtained from the DOE where the Speed Function and Focus Offset were varied [1]](http://www.metal-am.com/wp-content/uploads/sites/4/2022/07/03-5.jpg)
The dotted line represents the relative density of the initial powder, around 0.995 because of the internal porosity in the particles. As a result, a sample relative density value lower than 0.995 indicates that the EBM process induced porosity in the material compared to the initial powder. Therefore, a process parameter window, where samples are well-melted with a density higher than or equal to the initial powder density, can be identified (Fig. 4). The well-melted zone exhibits a peak in the lowest range of focus offset. For larger focus offsets, the well-melted zone broadens. This behaviour can be accounted for by the evolution of the beam spot size with the focus offset. Indeed, additional experiments have shown that the sharpest beam spot size was found at a focus offset around 12 mA and not at 0 mA as might have been expected. The authors associated this discrepancy with the calibration of the beam. As a consequence, in the range between 0 and 12 mA (focus offset), the energy input to melt the powder has to be lowered by increasing the scan speed to avoid over-melting. Similarly, for focus offsets larger than 12 mA, the scan speed is decreased to stay in good melting conditions. The larger well-melted zone for focus offsets above 30 mA might be related to the melt pool size (width and depth). With large focus offsets, the melt pool becomes larger and more shallow, but sufficient to melt the powder layers without leaving an un-melted zone.
![Fig. 4 Process parameter window (in term of Speed Function and Focus Offset) suitable for near fully dense parts. The white cross corresponds to the selected parameters (to produce Inconel 625 parts) [1]](http://www.metal-am.com/wp-content/uploads/sites/4/2022/07/04-5.jpg)
It should be noted that the limits between each zone have been drawn based only on the observation of the top surface of the samples. Additional investigations are in progress to identify more precisely the different melting zones.
In a second DOE, the scan speed and beam intensity were varied, the Focus Offset being kept constant and equal to 25 mA. A similar classification was used to characterise the top surface morphology of each sample. However, the results were plotted as a function of the surface energy Es and scan speed. The surface energy to melt the powder is given by the following equation:
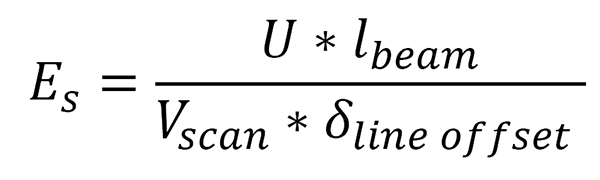
where U is the acceleration voltage (constant in this study and equal to 60 kV), Ibeam is the beam intensity (mA), Vscan is the beam scan speed (mm.s-1) and δline offset is the line offset (mm), i.e., the distance between two successive melted lines. A surface energy range to produce well-melted samples can be determined (Fig. 5). The required energy to ensure good melting of the powder layers decreases when the beam scan speed increases. The consequence of increasing the scan speed Vscan is that there is less time for heat losses by conduction between adjacent melt lines. Therefore, the energy required to melt the adjacent line decreases. This representation permits the processing time to be taken into account; a higher scan speed used to melt the samples decreases the melting time and consequently the time to manufacture the parts. In addition, the surface energy required is lower for high scan speed, thus reducing energy costs.
![Fig. 5 Process parameter window (in term of Surface Energy and Scan Speed) suitable for well-melted samples [1]](http://www.metal-am.com/wp-content/uploads/sites/4/2022/07/05-3-1024x652.jpg)
The microstructure of the sample, built using the optimum parameters (Speed Function = 70 and Focus Offset = 25 mA), showed a typical EBM grain structure, where columnar grains containing precipitates in the building direction are observed. The effect of process parameters on microstructure was then investigated. Three samples manufactured under the same conditions using the same scan speed = 900 mm/s and Focus Offset = 25 mA, but with different beam intensities, were characterised. The porous sample showed large levels of porosity because of a lack of melting, with the porosity being measured to be around 5%, The well-melted sample showed only spherical pores, ranging between 2 and 10 μm and most likely the entrapped gas pores already observed in the initial powder. The over-melted sample exhibited a reduced porosity, around 0.2%. This lower content of pores may be explained by a bigger melting pool arising from higher beam intensity. As the melted volume is higher than for the other samples, argon gas bubbles would have more opportunity to escape from the liquid metal during the solidification.
![Fig. 6 IPF-map of a well-melted sample (Beam intensity = 5 mA, Scan speed = 900 mm/s and Focus offset = 25 mA) [1]](http://www.metal-am.com/wp-content/uploads/sites/4/2022/07/06-4.jpg)
IPF-orientation maps were used to show the effect of the beam intensity on grain microstructure. Where the beam power leads to a well-melted sample, the observed microstructure was a columnar microstructure with strongly textured grains oriented along the Building Direction (with the [001] direction). The columnar grain width was measured to be about 100 μm and was found to be constant all along the sample height, Fig. 6. In the case of porous samples, as illustrated by Fig. 7, small equiaxed grains turned into columnar ones. After porosity induced by a lack of fusion, the grain nucleation took place in the first melted layers and then there was a subsequent epitaxial growth of the grains due to the successive layer melting. The full understanding of this phenomenon will require further, in-depth investigation.
![Fig. 7 EBSD map of a porous sample (Beam intensity = 3 mA, Scan speed = 900 mm/s and Focus offset = 25 mA [1]](http://www.metal-am.com/wp-content/uploads/sites/4/2022/07/07-3.jpg)
Grains in the over-melted sample exhibited the same texture as those in the well-melted sample but the grain width varied with the sample height, as shown in Fig. 8. This grain growth selection process results from the higher beam power leading to stronger deviations in the solidification direction. A growth competition between the grains occurs at each layer and, therefore, the grain with the solidification direction deviating least from the build direction grows preferentially.
![Fig. 8 Columnar grain width variation along an over-melted sample height [1]](http://www.metal-am.com/wp-content/uploads/sites/4/2022/07/08-3-1024x500.jpg)
Overall, the authors concluded that, based on their study, a process parameter window has been identified to produce near full density Inconel 625 parts by EBM, avoiding porosity, due to a lack of melting, and top surface waviness, that a clear correlation between process parameters and sample microstructure (porosity, grain size and texture) has been established and, finally, that the presented results can be used to produce complex EBM parts.
Selective Laser Melting of steels-based Metal Matrix Composites with ceramic reinforcement
A paper from S Sainz, F Castro and A Veiga (CEIT, Spain) and E Martinez and R Ninerola (AIMME, Spain), addressed the Selective Laser Melting (SLM) of steel-based Metal Matrix Composites (MMCs) with ceramic reinforcement. The authors stated that SLM offers the opportunity to manufacture MMCs that consist of a matrix material, in which a reinforcement material is embedded. However, the reported studies to date have concentrated on MMCs with non-ferrous matrices (Al, Ti and Cu) and information on SLM of steel matrix composites is very scarce. The presented paper, therefore, reported on a set of results obtained in the SLM processing of novel composites based on a 316L stainless steel reinforced by a dispersion of chromium carbides at different weight contents.
![Fig. 9 CAD sketch of a standard tensile testing specimen and image of the SLM processed parts [2]](http://www.metal-am.com/wp-content/uploads/sites/4/2022/07/09-3-1024x253.jpg)
The 316L stainless steel powder used in the study had the chemical composition reported in Table 2. The MMCs were obtained by mixing the base powder for four hours with three different amounts of reinforcement: 3, 6 and 9 wt.%. The SLM processing was carried out using a M3 model Concept Laser machine with 100 W power and a spot size of 0.2 mm. The laser scan speed was fixed at 400 mm/s for the skin and 500 mm/s for the boundary. The layers were scanned according to a chessboard pattern, establishing an overlap of 0.14 mm between neighbouring stripes inside the same island and 0.026 mm between islands. Tensile specimens were built, with different orientations of their axes with respect to the build direction z (Fig. 9).

Taking the 316L base material as a reference, Fig. 10 provides a comparison of the porosity obtained when adding the ceramic reinforcement at different levels. It can be clearly seen that there is an increase in porosity content obtained when mixing with the chromium carbides, particularly when observing the analysed section in the vertically built direction samples. The results for the MMC with 9%Cr3C2 were not included in this figure because of crack formation during the manufacturing process of these samples, indicating a limit for this hardening phase, at least for the processing conditions used. Overall, Fig. 10 indicates that the reinforcement material seems to have been homogenously distributed in the matrix.
![Fig. 10 Optical micrographs and corresponding porosity measurements of MMC tensile specimens [2]](http://www.metal-am.com/wp-content/uploads/sites/4/2022/07/10-2-1024x669.jpg)
The etched microstructure for the 3%Cr3C2-316L composite material is shown in Fig. 11. On the left side, the scan tracks are distinguishable and the direction followed by the laser is indicated with white arrows in the image. In the right hand micrograph, where the tensile axis has been built normal to z, the cross-section of the molten scan tracks are visible showing that the stainless steel powder particles were completely fused together within molten and solidified zones having curved edges. The laser tracks overlap, indicating that each molten track is bonded onto the other tracks nearby. In terms of porosity, the microstructures illustrate that this is directed and located between layers.
![Fig. 11 Cross-sectional microstructures of 316L+3%Cr3C2 tensile samples for (left) vertical and (right) horizontal building directions [2]](http://www.metal-am.com/wp-content/uploads/sites/4/2022/07/11-1-1024x377.jpg)
The results of the tensile tests carried out are summarised in Table 3. Addition of the reinforcement clearly increased strength level significantly and this effect is even more marked when the tensile test-piece axis was built normal to the z direction (presumably related to the lower level of porosity observed in this case). As expected, the opposite effect was observed in terms of elongation.
![Table 3 Tensile test results for the MMC materials [2]](http://www.metal-am.com/wp-content/uploads/sites/4/2022/07/t03-1-1024x435.jpg)
Fractographic examination indicated ductile fracture for the base 316L material, whereas the addition of Cr3C2 modified the fracture behaviour and presented an intermediate behaviour between ductile and brittle.
The wear behaviour of the various SLM-processed materials was measured using a dry pin-on-disc test method. The tests were performed according to ASTM Standard G99-03, using the following conditions: a chromium steel (60 HRC) pin of 6 mm diameter; a 6 mm friction track diameter; a sliding distance of 1000 m; a speed of 250 RPM; a 10N applied load; a relative humidity less than 35% and room temperature. The friction coefficient was measured during the test and wear was assessed using the wear coefficient k, (k = V/P l) where V is the volume loss of material, P the applied load and l the sliding distance.

Fig. 12 shows the wear behaviour of the materials. Friction coefficients were between 0.6 and 0.7. It is evident that unreinforced 316L stainless steel exhibited a higher volume loss, while the addition of the Cr3C2 particles to the stainless steel matrix was very effective in reducing volume loss during sliding. The best performance was obtained for the 316L+9%Cr3C2 material, as the reinforcing particles had increased the hardness of the composites, as indicated in the table included in the figure.
![Fig. 12 Wear rates and friction coefficients for the SLM-processed materials [2]](http://www.metal-am.com/wp-content/uploads/sites/4/2022/07/12-1024x743.jpg)
With a view to illustrating that more complex shape geometries could be built, to take advantage of the freeform technology, some prototypes were prepared as shown in Fig. 13. In this study, the composition with a 6% addition of carbides was selected. On the right of the figure, a gear is presented as an example of a component subjected to stresses and wear, which could be typically found, for example, in the automotive industry. In this sector, a good strength and wear resistance response combined with the lighter structures obtained by this processing technology should be of interest.
![Fig. 13 Prototypes of 316L-6%Cr3C2 processed by SLM [2]](http://www.metal-am.com/wp-content/uploads/sites/4/2022/07/13-1024x753.jpg)
Additionally, honeycomb structures (left in Fig. 13) for possible application as catalysts, have also been processed. Being tailor-made, three-dimensional structures of high added value, SLM technology looks to be of great potential value, because of the ability to reduce material wastage significantly. In the SEM images in Fig. 14, the differences in cell size can be appreciated for two of the structures designed. Major concerns in SLM parts are generally residual stresses and distortion. Due to localised heating, complex thermal and phase transformation stresses are generated during the process. In addition, frequent thermal expansion and contraction of the previously solidified layers during fabrication generates considerable thermal stresses and stress gradients that can lead to part distortion or fracture initiation. The cell sizes are reported in Fig. 14 and no significant distinction between the interior and surface locations was found, indicating low levels of distortion. Metallographic examination of the processed honeycombs revealed a fine cellular-dendritic microstructure and epitaxial growth determined by the heat flow.
![Fig. 14 Details of the cell sizes of two different honeycombs [2]](http://www.metal-am.com/wp-content/uploads/sites/4/2022/07/14-1024x424.jpg)
Based on the built component demonstrators, it was concluded that SLM was a viable route for the manufacture of complex-shaped parts from these stainless steel matrix composites.

Direct metal printing of zinc: From single laser tracks to high density parts
The Direct Metal Printing (DMP) of zinc was explored in a paper from Karel Lietaert and Lore Thijs (3D Systems, Belgium) and Wouter Baekelant and Jef Vleugels (KU Leuven, Belgium). Zinc alloys have emerged as one of the alloy groups considered promising for biodegradable medical implants and Additive Manufacturing has also emerged as a prime candidate for the building of patient-specific implants. The aim of the reported work was, therefore, the study and development of the DMP process for pure zinc, with particular reference to the influence of process parameters on the melting, evaporation and solidification of zinc powders.
Two different Zn powders were used in the study. The first (designated P1) was produced by air atomisation and the second (P2) was produced by nitrogen atomisation. Scanning Electron Microscopy (SEM) examination showed the air atomised powder to be clearly less spherical than the nitrogen atomised powder. Sphericity influences powder flowability in a positive way, as it reduces mechanical interlocking between powder particles. Also, the air atomised powder contained more small particles than the nitrogen atomised powder. The larger fraction of small particles in P1 also limits its flowability, because Van der Waals forces can dominate the gravitational force for small particles. As Table 4 shows, P2 has a better flowability than P1. A good flowability is important as it helps to deposit a uniform powder layer with the scraper blade. All DMP machines with a scraper type deposition system face this limitation. Both powders contained some porosity and the amount of pores was similar for both powders.
![Table 4 Powder characteristics and light element contents for Zn powders P1 and P2 [3]](http://www.metal-am.com/wp-content/uploads/sites/4/2022/07/t04-1-1024x234.jpg)
Instrumental Gas Analysis (IGA) showed that both powders contained similar amounts of oxygen (Table 4). Oxygen is known to disturb melt pool dynamics in both DMP and laser welding. Given the oxygen content of both powders, this effect is expected to be similar for both. The nitrogen content was also similar for the two powders, while P1 contained more hydrogen than P2. Hydrogen is known to cause pores in aluminium alloys processed by DMP, but the effect for Zn was unknown.
The laser absorptions of P1, P2 and a Ti reference powder were 76%, 73% and 70%, respectively. The authors stated that the difference between P1 and P2 could have been caused, among other parameters, by the differences in particle size distribution, particle shape or surface roughness. The laser absorption of the Zn powders was similar to that of the Ti powder and this shows that Zn is not an unusual material in this respect. The exact value of the laser absorption is, in fact, of limited importance, as the laser energy is mainly absorbed in the liquid melt pool and not the powder bed during DMP.
A customised version of a ProX DMP 320 machine (3D Systems) was used for the DMP experiments. This machine has a maximum laser power of 500 W. For all experiments, a Zn base plate was used, in order to prevent wetting or inter-diffusion problems.
The DMP studies comprised a series of 1D, 2D and 3D experiments. In the 1D experiments, in order to explore the process window for DMP of Zn, single tracks were initially melted along the surface of a bare Zn plate. Stable processing conditions are generally different for the surface re-melting of bulk materials and powder beds. Therefore, the result of this experiment could only be considered as an estimation of the process window for DMP. A range of laser powers and scan speeds were explored, as shown in Fig. 15. Single tracks were considered stable when a clear, continuous, melted track with surface ripples and a constant track width was obtained. Personal judgment was used to categorise the melted tracks. Fig. 15 shows the process map with indications of the different regions. For stable melted tracks, the energy density (ED) is given.
![Fig. 15 Single tracks on a Zn plate (no powder) showing that, only for an energy density of 25 J/mm and higher, a stable melted track can be obtained. For high scan speeds, melted tracks become unstable [3]](http://www.metal-am.com/wp-content/uploads/sites/4/2022/07/15-1024x286.jpg)
Next, a similar experiment was repeated on a bed of powder P1 over the Zn plate. The thickness of the first powder layer is difficult to control and the exact thickness value was therefore unknown. Fig. 16 shows the process map with an indication of the different regions. A comparison of Figs. 15 and 16 shows that, with powder, (i) the region without formation of a melted track is smaller, (ii) a new region with excessively high energy density exists and (iii) fewer combinations of laser power and scan speed lead to a stable melted track. The first and second observation can be explained by the higher laser absorption of metal powders compared to bulk metals.
![Fig. 16 Single tracks on a Zn plate with Zn powder P1 result in a smaller stable region compared to single tracks on a bare Zn plate (see Fig. 15) [3]](http://www.metal-am.com/wp-content/uploads/sites/4/2022/07/16-1024x338.jpg)
The 2D experiments were aimed at studying material evaporation and, therefore, smoke formation. Laser welding research has shown that vaporised metal forms nanosized particles in the weld plume. Absorption of laser energy by these particles can lead to process instabilities. During DMP, the smoke is removed from the process zone by an inert gas flow. The low melting temperature (694K) and the small difference between melting and boiling temperature (487 K) of Zn promote evaporation. Fig. 17a shows an example of an unstable process, where the absorption of laser power has resulted in a shift from the region with an excessively high energy density to the region without a melted track. This situation was created on purpose by reducing the gas flow over the powder bed. Fig. 17b shows the nanosized particles that form after Zn evaporation and confirms that the same phenomena, as studied in laser welding, occur during the DMP of Zn.
![Fig. 17 (a) Excessive smoke formation can lead to an unstable process by variations in the level of laser energy absorption. (b) Smoke consists of 10-500 nm particles. (c) No smooth surface could be obtained with P1 powder. (d) With P2 powder, melted tracks of high quality and sufficient overlap could be obtained [3]](http://www.metal-am.com/wp-content/uploads/sites/4/2022/07/17-1024x771.jpg)
Scanning a full layer instead of a single vector requires the introduction of an additional parameter, the hatch spacing (distance between two vectors). The choice of the hatch spacing was based on the width of the stable melted tracks obtained in the previous experiments. In order to limit the evaporation of Zn to a level manageable by the gas flow system of the ProX DMP 320, the stable melted track with the lowest linear energy density was chosen (ED=0.25 J/ mm). The width of the track was around 165 μm and the hatch spacing should be smaller than the track width to ensure sufficient overlap between different tracks. However, it should not be too small, as this would lead to a high energy input and thus excessive evaporation. A hatch spacing of 100 μm was chosen as a compromise between these two requirements. Fig. 17c shows the result after scanning 25 layers of thickness 30 μm with powder P1. The result was very different when using powder P2, as shown in Fig. 17d. Fig. 17d shows melted tracks of a good quality, whereas the melted tracks in Fig. 17c look very unstable. As the chemical compositions of the powders were very similar, the difference is more likely caused by powder morphology. The formation of a smooth layer of P1 powder might be possible on a bare plate; however, deposition on a scanned surface is probably more difficult. Even small irregularities of the surface can lead to mechanical interlocking with particles of P1 and disturb powder deposition. This can lead to a different layer thickness at different positions on the build platform and a progressive worsening of surface quality as more and more layers are built. The overlap of the melted tracks in Fig. 17d was deemed to be sufficient, as no porosity between the melted tracks was visible. The authors stated that further investigations will focus on a smaller overlap and a further reduction in smoke formation.
In the 3D experiments, cubes with dimensions 10 x 10 x 10 mm were built. Fig. 18a shows a vertical cross section of such a cube produced with powder P2, using a layer thickness of 30 μm, linear energy density 0.25 J/mm and 100 μm hatch spacing. Despite the small process window caused by the high evaporation tendency, the analysis of this image showed that a relative density >99.70% was obtained. Fig. 18b shows the microstructure of the cross section. A strong texture in the building direction was present. This effect has also been reported for other materials and should have a strong influence on the mechanical properties of the material. The authors indicated that this will be the subject of further research.
![Fig. 18(a) Metallographic analysis shows that a relative density of >99.70% was obtained. (b) Grain growth is mainly parallel to the building direction. Grains grow across multiple layers [3]](http://www.metal-am.com/wp-content/uploads/sites/4/2022/07/18-1024x381.jpg)
The authors concluded by stating that, in order to validate Zn for the production of personalised biodegradable implants, the microstructure, mechanical properties and degradation rate will need to be investigated further.
References
[1] Additive Manufacturing of Inconel 625 superalloy produced by Electron Beam Melting, E Chauvet et al, as presented at the World PM2016 Congress, Hamburg, October 11-14 2016, and published in the Proceedings by EPMA, UK.
[2] Selective Laser Melting of Steels-Based Metal Matrix Composites with Ceramic Reinforcement, S Sainz et al, as presented at the World PM2016 Congress, Hamburg, October 11-14 2016, and published in the Proceedings by EPMA, UK.
[3] Direct Metal Printing of Zinc: From Single Laser Tracks to High Density Parts, K Lietaert et al, as presented at the World PM2016 Congress, Hamburg, October 11-14 2016, and published in the Proceedings by EPMA, UK.
Author
Dr David Whittaker is a consultant to the Powder Metallurgy industry.
Tel: +44 (0)1902 338498
Email: [email protected]
Proceedings
The proceedings of the World PM2016 technical sessions and poster program are published in digital format by the European Powder Metallurgy Association. For more information visit www.epma.com
LAST MONTH’S MOST-READ ARTICLES