

The inspection and quality control of metal AM parts with X-ray Computed Tomography (micro CT)
X-ray Computed Tomography (micro CT) is just one option for the inspection of metal AM parts. Other options include using eddy current, ultrasonic technology, white-light interferometry and non-interferometric optics. However, given recent developments, it is micro CT that has the most potential in view of its unique capability for the inspection of complex internal structures and geometries without destroying the part. The capabilities of this inspection method are presented by Andrew Ramsey and Herminso Villarraga-Gomez of Nikon Metrology Inc. [First published in Metal AM Vol. 3 No. 2, Summer 2017 | 15 minute read | View on Issuu | Download PDF]

X-ray Computed Tomography (micro CT) is the only non-destructive testing method that is able to effectively inspect – with measurement strategies from coordinate dimensional metrology – volume defects and complex geometry inside a part. Eddy current testing can only inspect local defects near the surface of a part, while ultrasonics can inspect only simple geometries near the surface with some reach inside the volume. Optical and interferometric methods can only inspect features at the surface of the part. While the latter (interferometric) techniques are very good at achieving higher resolutions (up to a few nm), the micro CT technique can cover, in a single scan, external and internal surfaces, with micrometre-level resolution and, in some cases, at higher resolutions below the micrometer level (on the order of a few hundred nanometers).
The growing interest in micro CT comes at a time when interest in Additive Manufacturing is redefining the manufacturing landscape. Consulting firm IDC states that global spending on AM equipment, both desktop and industrial, reached about $11 billion in 2015 and is forecast to reach $27 billion by 2019. Another company, MarketsandMarkets, is predicting that Additive Manufacturing will experience 30% compound annual growth and reach $30 billion by 2022. In its April 2016 study, “3D Printing Comes of Age in US Industrial Manufacturing,” Price Waterhouse Coopers (PWC) stated that, compared to two years ago, more manufacturers (52% this year compared to 38% in 2014) expect Additive Manufacturing to be used in high-volume production in the next three to five years.
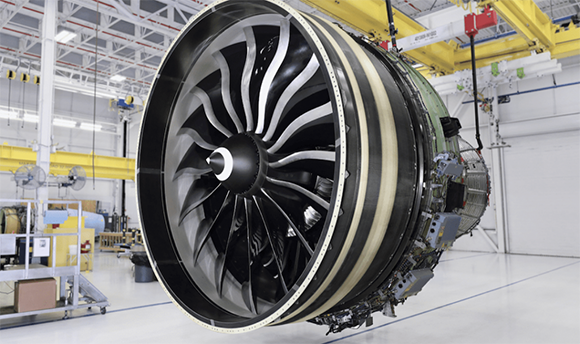
Metal AM parts are increasingly being considered for the reduction of component weight without compromising strength, for example in aerospace applications where decreased weight leads to increased efficiency. For such safety-critical aerospace components, as well as applications in automotive, energy and medical devices, it is essential to know whether voids or inclusions are present, how large they are (both individually and in total) and where they occur. Additionally, it is critical to know whether the dimensions of the part conform to those of the design.
In such cases, X-ray Computed Tomography is a powerful tool. By supplying a full 3D density map of a sample, micro CT gives all this information in an easy-to-read visual format.
Welds need to be inspected, so why not AM parts too?
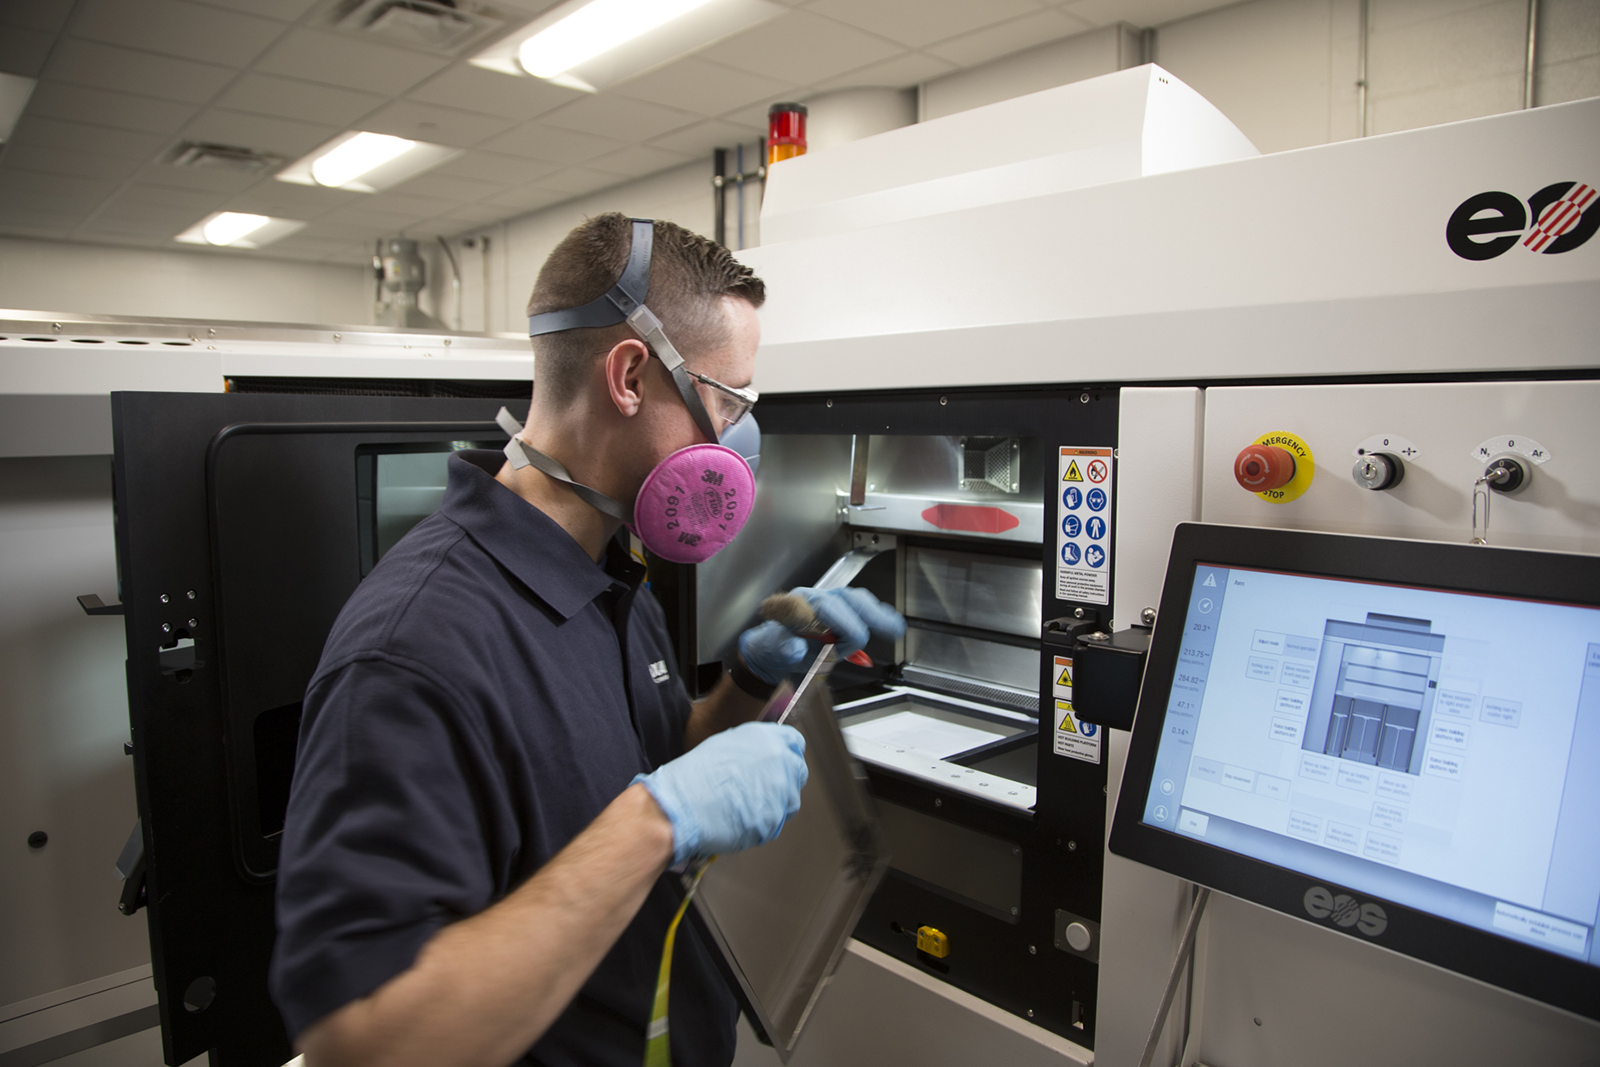
Using conventional manufacturing processes, one would always inspect a weld for voids and inclusions. In metal Additive Manufacturing, the whole sample is essentially one large weld, so not to inspect it for voids, inclusions and dimensional accuracy would be a huge leap of faith in the process. Because of the complex nature of metal Additive Manufacturing processes such as Powder Bed Fusion, where for example there is the risk of risk of loose, partially melted powder in the build chamber, the position and nature of defects is often totally random.
With traditional manufacturing processes, a few radiographs at specific orientations can often give peace of mind. However, with layer-based Additive Manufacturing processes the whole part needs to be inspected. When checking the structural integrity of these parts, it is primarily the following issues that are of concern:
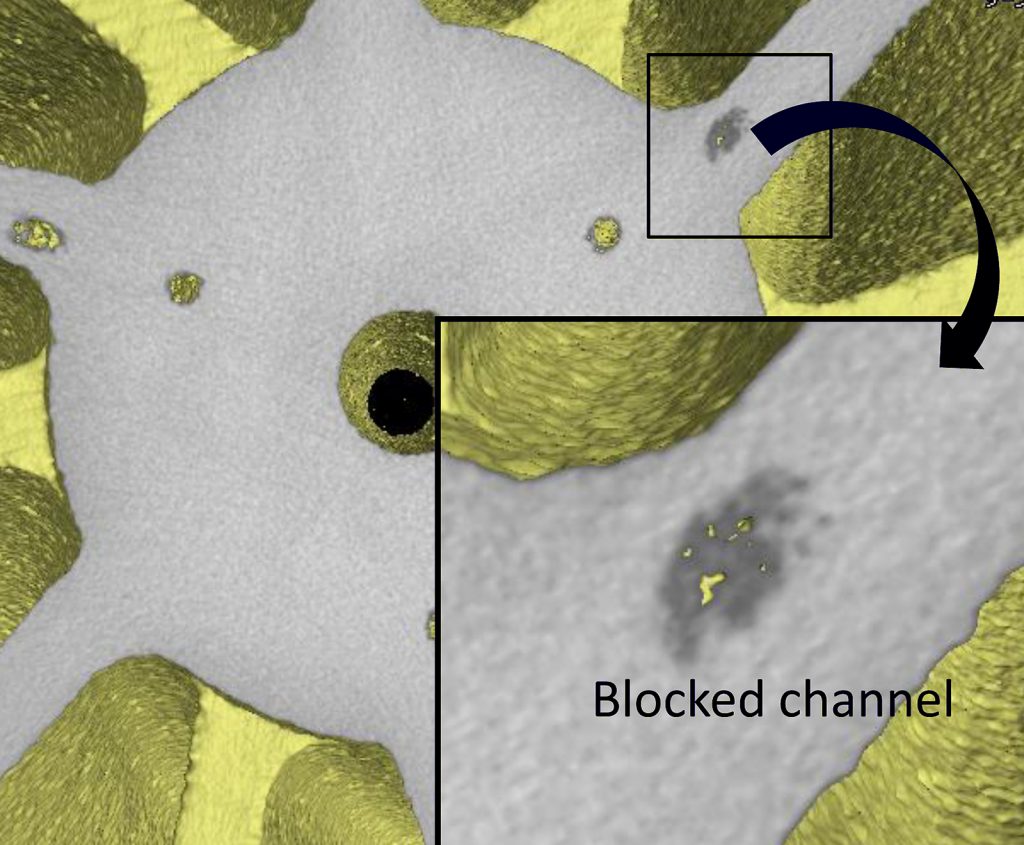
- Powder residues blocking channels
- Defects (voids and inclusions) – porosity, contamination, cracking
- Departure from the CAD model – dimensional analysis, wall thickness measurements, warping.
As an example, a mould made by Selective Laser Melting was designed to make a small knocker for a watch mechanism. Micro CT could determine the cooling and flow channels built in by the metal AM process to an accuracy of 5-10 µm, depending on acquisition parameters. From flow and cooling simulations, this is known to be of sufficient accuracy for the purpose.

In fact, micro-CT can find defects within samples down to a resolution given by the number of pixels across the detector. Given a sample 100 mm across and a detector 2000 px across, the limiting resolution would be 50 µm. Resolution is also limited by the focal spot size of the X-ray source, which may range from 80 µm for high energies down to less than 1 µm for low energies. Defects below the nominal resolution may also be spotted if the contrast with the surrounding material is great enough. For example, given a 3 µm X-ray focal spot, we can still see a 0.5 µm gold foil edge-on.
The size of sample which can be scanned with CT depends on the material it is made from and the energy of the X-ray source, measured in kilovolts (kV). Larger, lower density samples can be scanned, as can smaller, higher density samples. Typical largest samples are:
- 225 kV – aluminium piston heads; diesel injectors
- 450 kV – aluminium cylinder heads; aircraft turbine blades
Maximum part size also tends to be limited by the size of the detector, but also by the penetrating power of the X-rays. This decreases as material density and atomic number increases. Much greater thicknesses of polymeric materials can be penetrated than steel, and much more steel than tungsten.
CT scanning case study
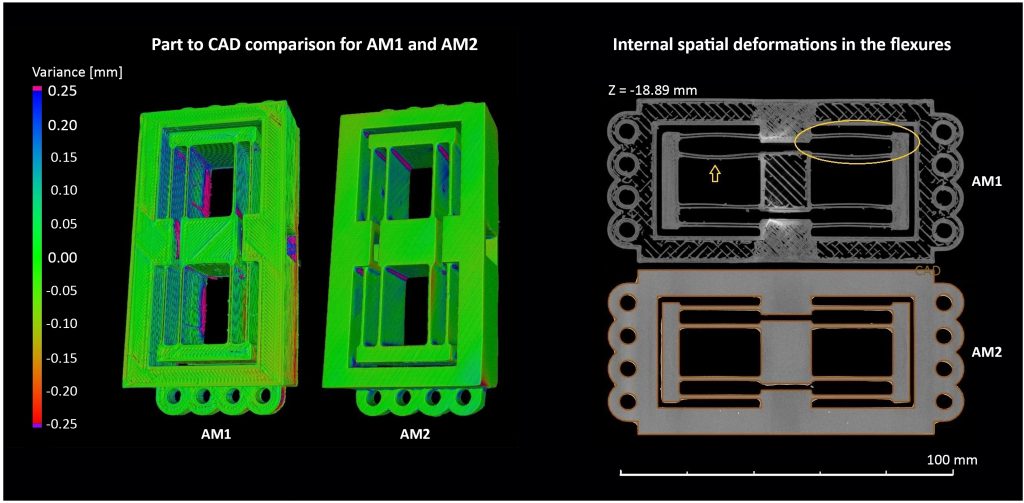
An investigation into the micro CT scanning methods for a flexure mechanism fabricated by Additive Manufacturing offers insight into the capabilities of the process [2]. Whilst this research was in relation to polymeric products, the principles and benefits apply equally to metal AM applications. A first flexure sample (AM1) was manufactured by Fused Deposition Modelling (FDM). A second sample (AM2) was manufactured by Stereolithography (STL). For reference, the FDM and STL processes have, in general, printing resolution of approximately 100 µm and 0.5 µm, respectively.

Micro CT scans show variance analysis for both AM1 and AM2 flexures against the original CAD model (Fig. 4, left). From the measurements, it can be seen that deviations from the nominal geometry (CAD model) rise up to ±0.25 mm and larger when using the AM1 process. In contrast, the AM2 process generated part-to-CAD deviations mostly between ±0.1 mm, with a few exceptions, particularly around surface edges or corners. In addition to external checks, a cross section of AM1 shows residual internal and spatial deformations (Fig. 4, right). On the other hand, the manufactured part generated by the AM2 process does not reveal the presence of major deformations in the thin-walled flexure leaf structures.
Rules of micro CT and when to break them
High-accuracy micro CT technology has continued to evolve over the past ten years. Applications are diverse and growing across the automotive, aerospace, energy, medical and consumer sectors, dealing with metals and exotic alloys as well as plastics and other workpiece materials. Accompanying software tools enable the analysis of part volume against the CAD model, either via direct volume-to-CAD comparisons, or through geometric dimensioning and tolerance measurements. With costs now low enough to make it competitive with other techniques, micro CT can now be considered for application in many broader metrology applications.
A better understanding of the rules of micro CT not only opens the door to production cost savings and productivity improvement, but knowing when to break them can provide even further process flexibility. The rules for good micro CT are as follows:
- Penetrate the sample from all angles
- Minimise noise in each projection image
- Use filters to reduce beam hardening
- Always use 360° rotation
- Use the detector’s full dynamic range
- Keep the object in the field of view
X-ray basics
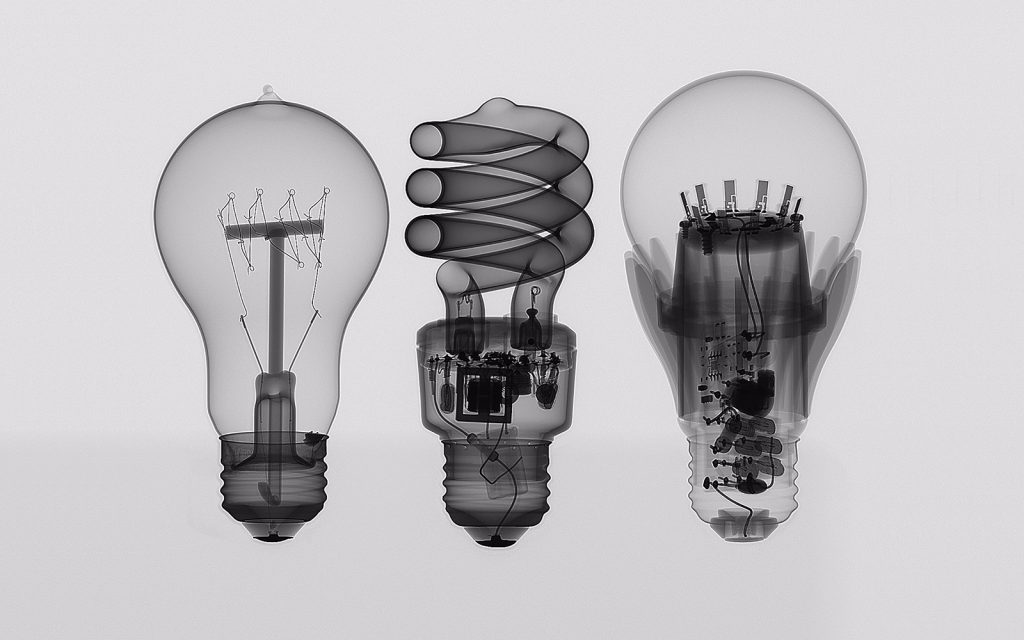
X-rays are at the short end of the electromagnetic spectrum with an average wavelength between 10-8 and 10-12 metres, around the size of water molecules, compared to radio waves whose wavelengths could span a soccer field. There are no radioactive sources in micro CT; rather electrons are produced from a hot filament similar to a light bulb and accelerated at high voltage, reaching speeds of roughly 80% of the speed of light. They are fired at a metal target through a magnetic lens that focuses the beam energy into a spot between 1-5 µm in diameter. The sudden deceleration of the charged electrons when they hit the metal target produces more than 99% heat and less than 1% X-rays.
When the electrons hit the target, X-rays are created by two different atomic processes:
With enough energy, the electron can knock an orbital electron out of the inner electron shell of a metal atom. As a result, electrons from higher energy levels fill up the vacancy and X-ray photons are emitted. This process produces an emission spectrum of X-rays at a few discrete frequencies, sometimes referred to as characteristic emission lines
Bremstrahlung (decelerating or “braking” radiation in German): This is radiation given off by the electrons as they are scattered by the strong electric field near the high-Z (proton number) nuclei. These X-rays have a continuous spectrum. The intensity of the X-rays increases with decreasing frequency
X-rays travel in straight lines through the object being inspected and onto a detector. The object will absorb some of the X-rays (denser objects absorbing more), leaving only a portion to reach the detector. At low X-ray energies (<60 kV), differences of absorption along the X-ray path to the detector are detected and shown as a shadow image. At higher X-ray energies (60-225 kV), absorption and scatter occur. This scatter reduces contrast in the image. With X-ray energies above 225 kV, scatter becomes an increasing problem for an area detector. Above 225 kV, scatter can be rejected from the detected signal by a linear detector, although throughput decreases (fewer images per hour). At greater than 300–400 kV, scatter is the dominant contrast mechanism, i.e., more X-rays leave the beam from scatter than from absorption.
Amorphous silicon flat-panel detectors have a fluorescent screen, which converts the X-ray energy into light to form an image on an array of light-sensitive diodes. Electronics allow this image to be read by a computer. These panels can have pixel sizes over a wide range and sensitivities up to 16 bits (64 k grey levels).
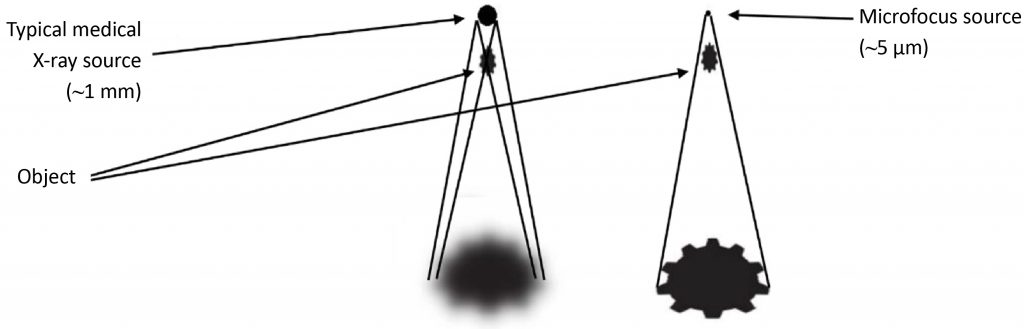
The sensitivity of the detector relates in part to the size of the X-ray source. A lot of typical high-power X-ray sources are minifocus, in the range of 1 mm across. This limits the resolution of images to that of the detector: a very fine detector is needed to get high resolution and no magnification is possible. Microfocus means the size of the X-ray source is only a few microns across. With a microfocus source, a standard medical detector can be used and geometric magnification can be used to gain a higher-resolution image (Fig. 7)
Micro CT overview
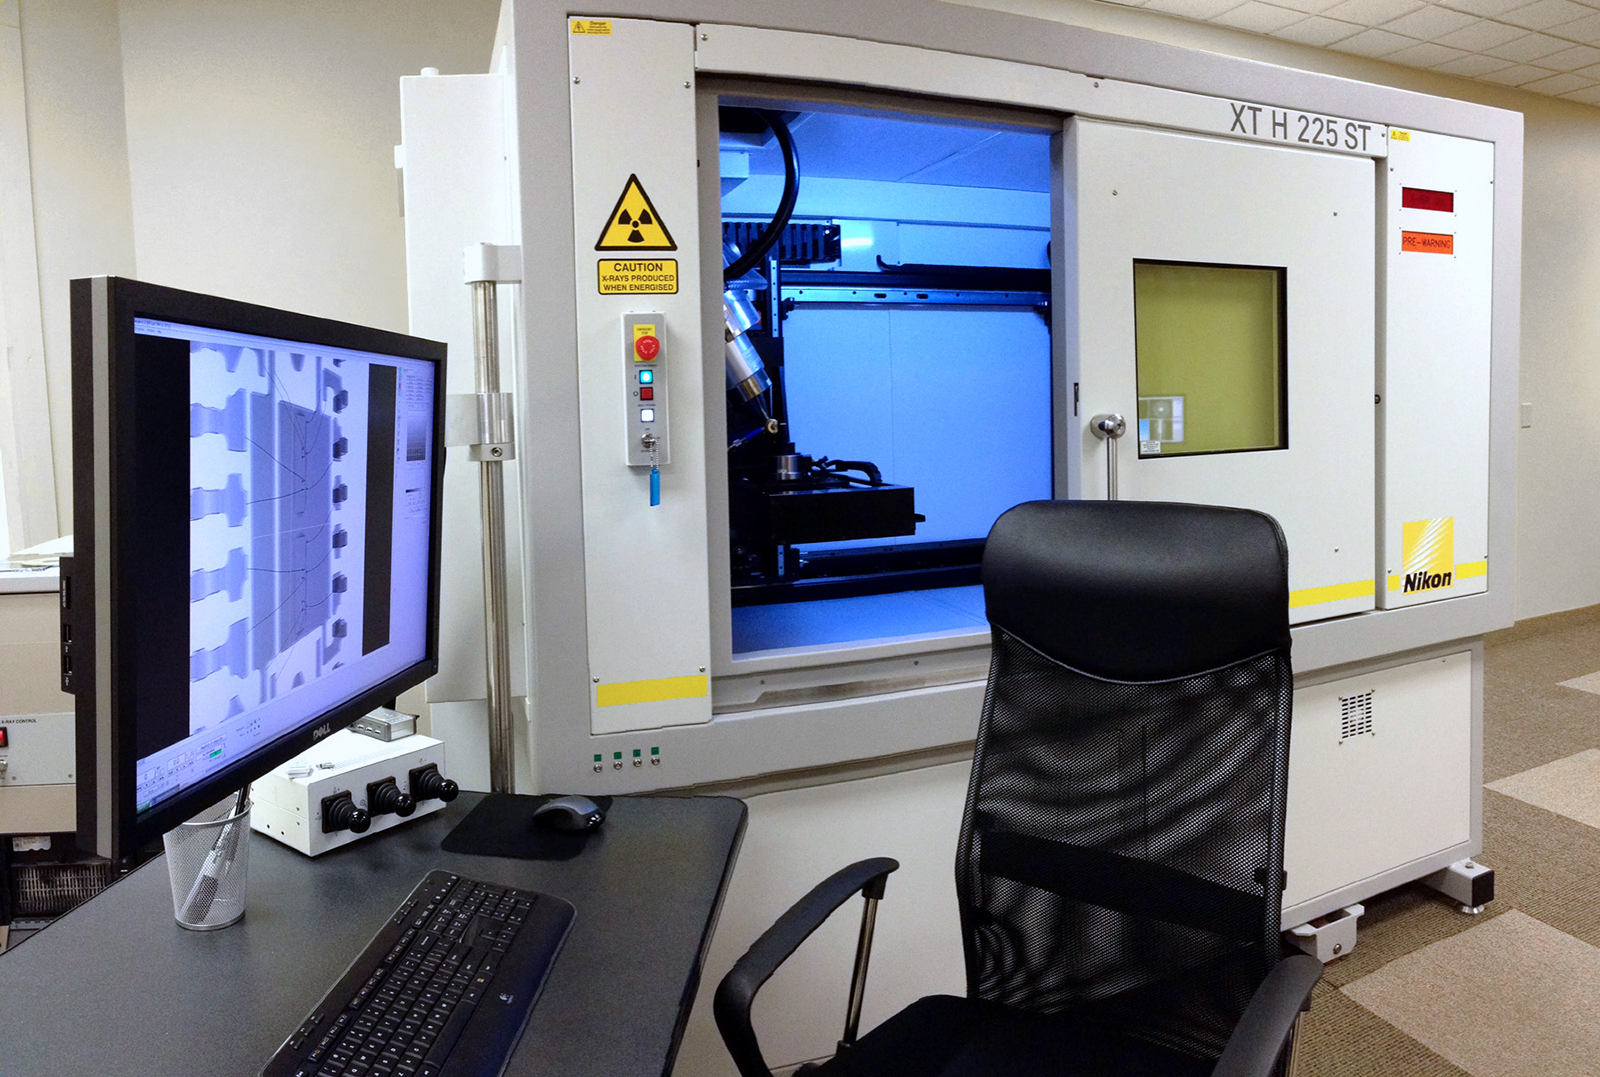
Combine the penetrating power of X-rays and the ever-increasing data-processing power of the computer and Computed Tomography is the result. The fundamental setup includes an X-ray source, the object being measured and a detector. A rotating platform for the object being imaged aids comply with Rules 1 (penetrate the sample from all angles), 4 (always use 360° rotation), and 6 (keep the object in the field of view).
Thousands of digital images can be produced from a single sample and each two-dimensional pixel in each image contributes to a three-dimensional ‘voxel’ as computer algorithms reconstruct 3D volumes. For example, with 3000 images, each voxel in the resulting billion or so in the volume is processed 3000 times. The result is a 3D volumetric map of the object, where each voxel is a 3D cube with a discrete location (x,y,z) and a density. Not only is the external surface information known, such as with a 3D point cloud from laser scanning, but internal surfaces and additional information about what is in between the surfaces from the fourth dimension (density) is provided. Furthermore, ‘slices’ produced by the process and accompanying software can yield much information without destroying the part.
Image intensity, then, becomes the basis for measuring the sample. In CT, what is being measured is the linear attenuation of the X-rays, or how much one unit of length of material reduces X-ray intensity. Unfortunately, imperfections or ‘artefacts’ can occur in CT data and can affect measurements considerably. Recall rule 2: “Minimise noise in each projection image.” Noise can appear as speckles in slice images, but can be minimised by maximising the X-ray dose.
There is also non-linear detector noise in the projection images that stays in the same position for all projection images. As images form, this noise is reconstructed as circular rings, i.e., ‘ring artefacts’. Noise in the reference images gives the worst ring artefacts because it is re-used to correct each projection image and therefore amplified. Noise in the black reference image is more significant than noise in the white reference image because the signal is lower in the black image, so the signal-to-noise is also less.
Ring artefacts are stronger nearer the axis of rotation because fewer reference image pixels are used. They can be minimised by averaging many frames when collecting black and white reference images.
Beam-hardening is the self-filtering of the X-rays by the sample, so the X-rays have a higher energy inside the sample and are therefore more penetrating. Because of this, the measured X-ray linear attenuation is lower inside the sample than at the edges, thus giving rise to beam-hardening, or ‘cupping’ artefacts.
Beam-hardening can be reduced by pre-filtering the X-ray beam (placing a filter over the output window of the X-ray source, as per rule 3). It can also be corrected, to some extent, by using the beam-hardening correction filters in the CT software. This works best with single-material samples.
It is important to use the full range of the detector, as per Rule 5. Higher dynamic-range detectors (more bits) help detect small differences in intensity due to low-density materials, such as plastics, in the presence of high-density materials, such as metal.
Streak artefacts are caused by beam hardening or lack of penetration of the X-ray beam through the sample. Lack of penetration can be solved by increasing the X-ray energy (kV) – unless, of course, you are at the maximum for the system.
Streak artefacts can be reduced by filtering the beam, applying a beam-hardening correction, or by using a detector with a high dynamic range. Scattered radiation can be reduced by collimating the X-ray beam and the detector to detect only those X-rays that travel in a straight line from the source to the detector.
Following the rules will give the best-possible CT results for full metrology purposes and is general good practice. However, if you need qualitative information (is a crack present or not, what is the sample’s porosity, how many densities are present, is an electrical connection made or broken), or the information needed will not be affected by the artefacts, then rules can be broken.
Rule 1: Penetrate the sample at all angles; Rule 6: Keep the object in the field of view
If the material not in view is relatively homogenous and uniform in shape, then it will only add a small ring at the edge. Internal features will be easily visible and usable. This allows us to zoom in and see more detail. If the feature being analysed is near the centre of the scan, or if the size of the feature is much larger than a single pixel, then the number of projections can be reduced to speed up the scan.
Rule 2: Minimise the noise in each projection image
If time is limited, reducing the noise in the black and white reference images will reduce the overall noise significantly without greatly increasing the length of the whole scan.
Rule 5: Use the whole dynamic range of the detector
When inspecting very low density specimens, very low energy X-rays are used to give good contrast in the images. To fill the dynamic range requires long exposures. Halving the exposure only loses one bit of information but saves a lot of time.
Conclusion
The rules of CT come out of the theory of CT reconstruction. Following the rules means you will most likely generate the best-quality CT data. However, sometimes breaking the rules can save a lot of time without compromising significantly on image quality.
Micro CT is now much faster and more suitable for production-line use. Moreover, CT scanning of similar parts can be automated for loading and unloading. Scan times down to a few tens of seconds per part are possible. Users gain:
- Better insight into the inside of metal AM parts
- Faster optimisation of the main prototyping and production processes
- Quality control – much higher confidence in incoming and outgoing parts
- Reduced costs by avoiding destructive testing
As AM continues to rewrite the manufacturing rulebook, X-ray Computed Tomography can be a powerful partner for non-destructively assuring geometrical tolerances and the assessment of internal defects.
Authors
Andrew Ramsey
Herminso Villarraga-Gomez
Nikon Metrology Inc.
12701 Grand River Ave,
Brighton, MI 48116, USA
[email protected]
[email protected]
www.nikonmetrology.com
References
[1] Villarraga-Gómez et al (including Ramsey A.), Assessing the Structural Integrity of Additive Manufactured Metal Parts with X-ray CT, Proc. ASPE/euspen 2016 Summer Topical Meeting, Raleigh, NC, Volume: 64, June 2016. www.researchgate.net/publication/304539205_Assessing_the_Structural_Integrity_of_Additive_Manufactured_Metal_Parts_with_X-ray_CT
[2] Herminso Villarraga et al, Assessing Additive Manufacturing Processes with X-ray CT Metrology, as presented at the 2015 ASPE Spring Topical Meeting, Raleigh, NC USA. www.researchgate.net/publication/283119260_Assessing_Additive_Manufacturing_Processes_with_X-ray_CT_Metrology
LAST MONTH’S MOST-READ ARTICLES