

Mass-production using PBF-LB: How laser beam measurements can help pave the way
Laser Beam Powder Bed Fusion (PBF-LB) is a technology rich in process parameters and exacting material specifications, all developed with the aim of delivery quality and repeatability as the industry moves towards volume production. However, without control of a laser’s focal spot, neither the material specification nor the handling of the material in the build chamber can guarantee the hoped-for results. As Ophir Spiricon Europe’s Christian Dini explains, when it comes to lasers, there is no control without the gathering of reliable data. [First published in Metal AM Vol. 6 No. 2, Summer 2020 | 20 minute read | View on Issuu | Download PDF]
Is Additive Manufacturing ready for mass-production? The answer really boils down to reproducibility. When it comes to Laser Beam Powder Bed Fusion (PBF-LB), the constancy of the laser parameters is of great importance. Both AM machine manufacturers and machine users need to be aware of the quality of the focused beam that they are using. So, is it possible to test this quickly and cost-effectively during operation? To answer this question, one must take a closer look into the function and construction of laser-based AM systems.
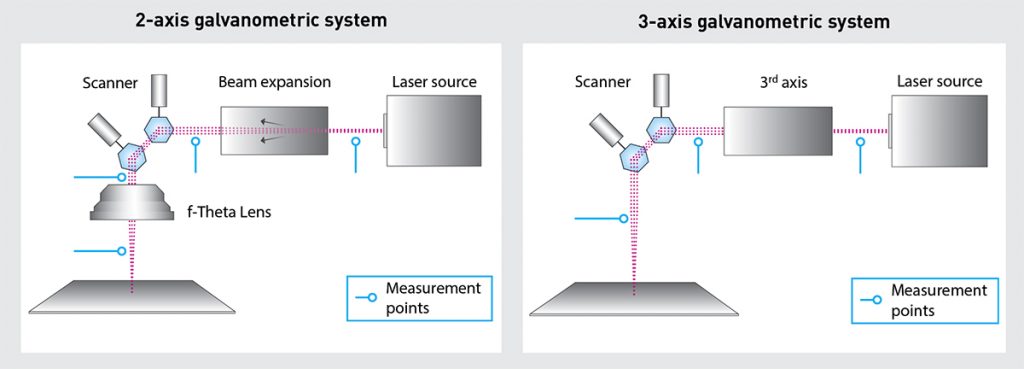
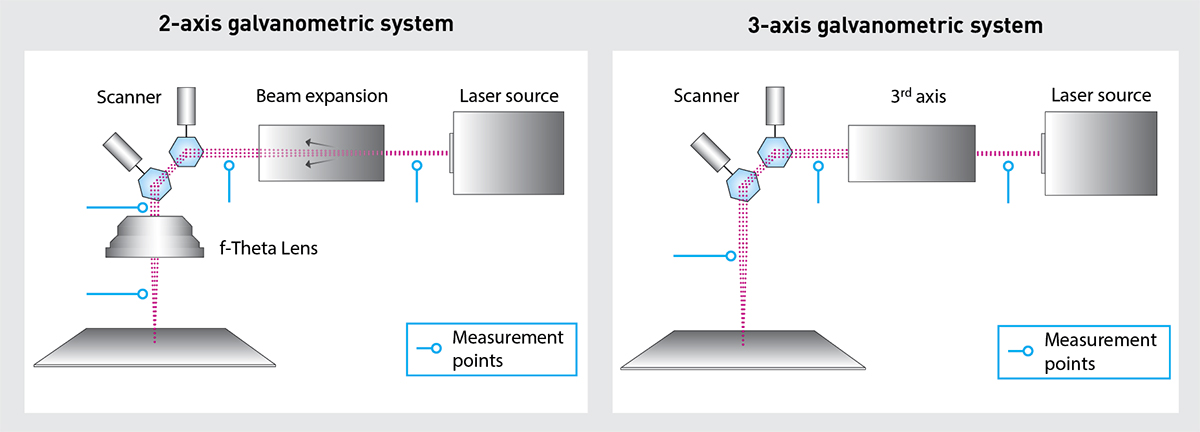
Most PBF-LB metal AM machines have a number of beam delivery components in common. Starting at the fibre laser source with the beam delivery fibre and beam expansion optics, either a 2-axis or a 3-axis system follows. The 2-axis system (Fig. 1, left) consists of a 2-axis galvanometric scan head and a focusing F-Theta lens. For the 3-axis systems (Fig. 1, right), the F-Theta lens is replaced by another beam expander built from three lens elements with two fixed and one moving lens, changing the focal distance of the entire assembly as needed when the beam is steered over the working plane, using again an X-Y-galvanometric scanning head.
Finally, a protective window separates the optics or the scanner from the work chamber. To improve flexibility, there might be a pair of beam benders (or turning mirrors) in the beam path to help alignment of the expanded beam into the scan heads. Different strategies are applied within the working chamber, such as heating it up or purging it with process gas, but they will not be the focus of this article.
Leaving material-related and work strategy questions out of the equation, the crucial question in terms of achieving reproducibility is how the optical components, with their coatings, power densities and alignment, influence the production process, and how the interplay between them can be managed to achieve constant beam parameters. As if the challenge to set up one laser beam path and manage the optics involved isn’t enough, larger parts are built using even more complex multi-laser systems. The basic structure of the entire beam delivery is replicated up to four times in one PBF-LB system, working in a stitching mode. The individual laser beams not only need to be aligned precisely in order to achieve durable, high quality parts. They also need to be matched to almost identical performance – a more than challenging task.

Why is power density the key?
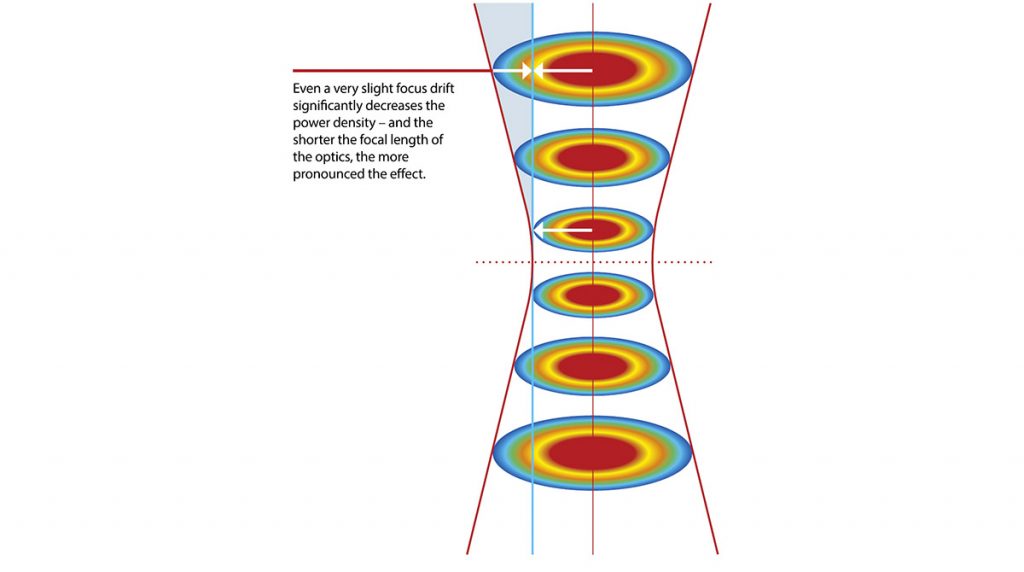
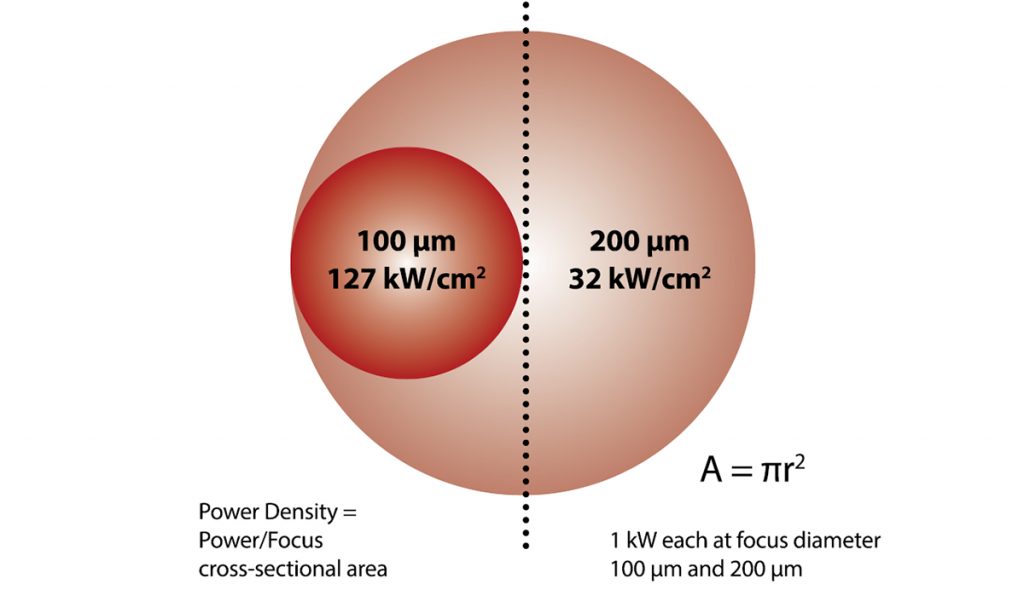
One of the key parameters within PBF-LB processes is the power density of the laser beam. As the power density is defined as power per unit area, its calculation is straightforward. The beam’s power is divided by the area of a beam using the radius. Most lasers present a beam profile that is most intense in the centre and decreases in power density as you move away from the centre. This symmetrical bell-shaped pattern is called a Gaussian distribution. Alternatively, a so-called top hat or flat top beam profile might be used with the aim of maintaining literally the same power density across the beam cross section. For any beam shape in common, the critical point is that even a slight shift in focus position (see Fig. 2) causes a significant change in power density as the area of the beam varies.
Take, for example, a 4000 W laser focused to a 100 µm diameter spot size; the average power density of the focused beam will be 51 MW/cm². A 10 W beam can create an average power density of 32 kW/cm² if focused to a 200 µm spot, or 127 kW/cm² average power density if focused to a 100 µm spot (see Fig. 3)
The parameters of concern
In most cases, the beam exiting the laser will not have the size, shape or intensity profile needed for the application. The laser beam will be expanded and may be shaped, and can be steered by galvanometer mirror systems and travel through several transmissive optics before reaching the process. However, optics and mirrors gradually absorb more laser light as they degrade, causing the delivered laser power to decrease over time.

Some wavelengths of light are very hard on system components. Thermal effects caused by absorption will change the size or location of the focused spot. This is known as ’thermal lensing’ leading to ’focal shift’. If the laser focuses before the work plane, the power density is reduced as the beam is expanding before impinging on the work surface and, even further, high power densities might lead to creation of a plasma in the focal spot region that can impact the beam quality. If the laser focuses beyond the work plane, the power density is also reduced. Knowing the exact location of the focused spot is essential to quality output. To ensure a consistent process over time, regular measurement of the laser beam is necessary to control performance. The engineers developing new PBF-LB machines, as well as the production technician, need to know:
- Spatial intensity distribution
- Location of the focused spot
- Power and energy at the focused spot
- Quality of the beam
- Divergence
- The stability of each of these parameters over time.
How to define a measurement strategy
Within the process of defining a measurement strategy, the machine manufacturer and the user will have to answer the same questions:
- Where and how often do we have to measure?
- What are the drivers to choose a certain measurement technology?
As the measurement process of the machine manufacturer starts way before the laser beam enters the build chamber, the answers will certainly be different to those of a machine user. Within the development of an PBF-LB system, different measurement points along the beam path are chosen to determine possible losses at the individual elements and to correctly align the beam delivery components to the laser beam axis (see the measurement points in Fig. 1). During the lifecycle of an PBF-LB system, the machine manufacturer needs to take many measurements: in the product development, in production, in quality-related end-of-line testing and when the system is serviced once it is installed on the customer’s premises. In order to be able to compare the gathered data points taken in those different stages, their continuity should be guaranteed ideally by using the same metrology technology all the way.

End-users, on the other hand, usually have no access to the beam delivery path. They have to rely on the information about the focused beam as measured in the build chamber to judge the quality of the PBF-LB process. This also results in a different approach when choosing the suitable measurement strategy. While the machine manufacturer is most interested in obtaining absolute measurements to define the parameters needed for the PBF-LB process, for the user, it is normally sufficient to have trends. By measuring the laser beam each time between unloading and loading the machine, even slight deteriorations will be revealed quickly and the process can be changed accordingly by adjusting the process parameters or performing preventive maintenance in order avoid putting a whole build job at risk, losing time and expensive material in the process.
For the measurements that are taken within the build chamber in particular, the ease of use of the measurement device plays a key role. Fast positioning, easy alignment and a low risk of damaging the device will enhance your team’s acceptance of the practice of taking frequent measurements. A short measurement time is also important, as this is the prerequisite to be able to integrate regular measurements into the production process. Using CCD Camera-based technology will provide a time resolution at video rate to reveal changes of the focused laser beam when going from cold to warm, the typical state of operation even through the build process. Thermal equilibrium is very rarely achieved as an operational condition of a laser system employing scanning systems for beam steering.
Measurement solutions
The most commonly used approaches over the last twenty years have been the scanning slit beam profiler for low and medium powers, and the scanning tip with a pinhole for higher powers, which samples a small portion of the beam and presents it to a single element detector. For both, the rotational scanning of the slit and translational scanning of the pinhole through the beam creates a 2D image of the beam profile. While the scanning slit devices are rather compact and low cost, the method of scanning tip does require large-scale equipment with moving mechanical parts and a water chiller, along with expert knowledge on the part of the operator and time to complete a measurement. Since scanning tip equipment is relatively expensive to purchase and to maintain and slow to take measurements, the use of this technology is not very practical in production environments.
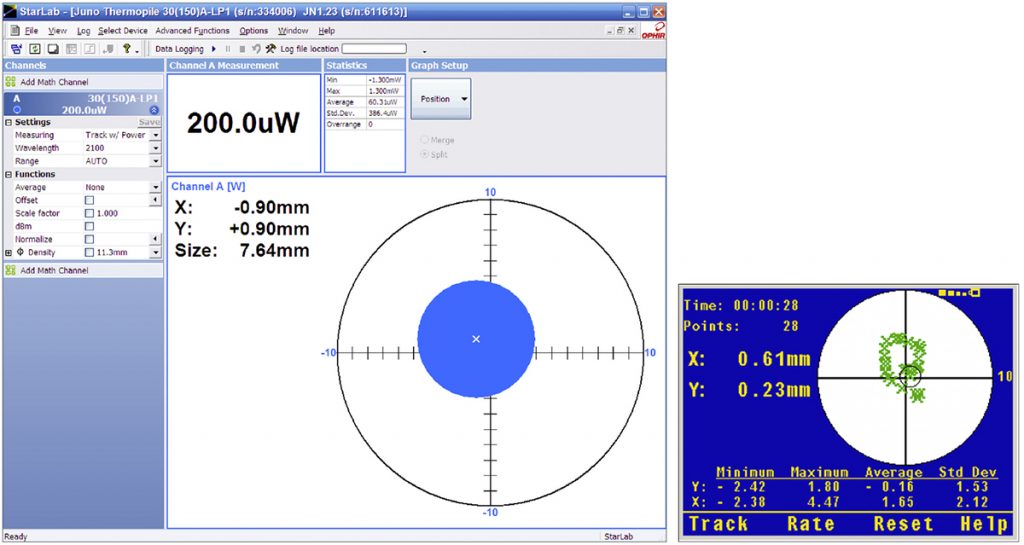
Secondly, there are quadrant sensors or power position sensors (PPS), which measure not only the power but also the position and size of the laser beam, going a step further than conventional power gauges. They are used to adjust the beam delivery, as well inside the build chamber. When the sensor is positioned centrally and moved vertically, the beam position should not show any movement. Any change in the measured beam position indicates an offset in the deflection head or a misalignment in the beam path. To a certain extent, this sensor technology can also be used to determine the accuracy of the beam adjustment in the peripheral areas of the building plane – in terms of both power and beam position.
Ophir LBS-300 HP-NIR beam profiler
Recently, a third option for measuring the high-power beams used in PBF-LB has emerged. Thanks to a newly developed beam attenuation technology, it is now possible to use a lower-cost CCD beam profiler (a well-known, low-power technology) to measure the laser beam in the working chamber. This approach can be seen in the new Ophir LBS-300 HP-NIR (Fig. 5), a beam attenuation system designed for focused spot beam analysers that combines dual sampling optics and neutral density filters for beam attenuation before the focused spot reaches the camera. This innovative beam splitter is designed for high-power lasers and employs newly engineered sampling optics that allow measurement of NIR (1,000–1,100 nm) focused or collimated laser beams profiles up to 5 kW or 15 MW/cm2. With this technology, a low-cost system is now available that provides the usual 2D and 3D beam profiles, as well as the capability for fast measurements of both an image integrated over a certain period of time and of the full-beam profile with dynamic changes at video rate.
Ophir BeamWatch AM
The fourth alternative to measure the laser beam within the working chamber is by using a non-contact measurement technology based on Rayleigh scattering of the laser beam. This technology was developed by Ophir and further enhanced for use in Additive Manufacturing systems such as the Ophir BeamWatch AM measurement device (Fig. 6). The lightweight, compact system measures beam position and angle of incidence, focal spot size, position and quality parameters such as M² and beam caustic in real-time. These measurements allow users to easily determine when the beam is aligned and in focus, providing more consistent material behaviour. Measurements can be displayed in tabular, 2D or 3D views, providing a quick and realistic display of laser characteristics. The advantages of non-contact laser beam measurement are particularly important at higher power densities of more than 2 MW/ cm2, as currently required in PBF-LB. Because the instrument can record power of up to 1 kW for as long as two minutes without needing active cooling, it can be used in R&D as well as in production and service. The comparability of the measurement results, which plays such a crucial role for manufacturers, is guaranteed at all times.
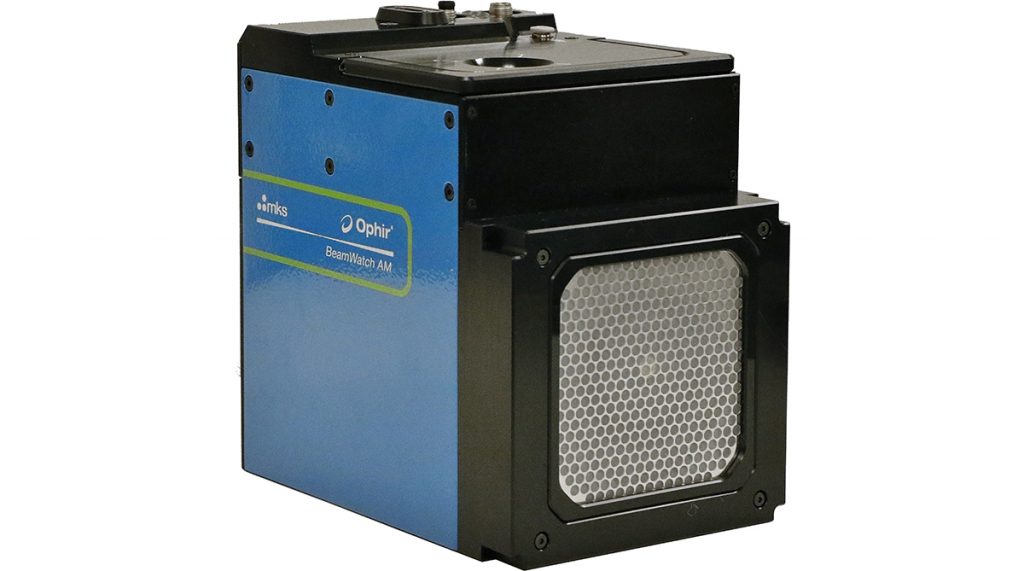
When designing Ophir BeamWatch AM, an important factor for Ophir was its ease of use. The non-contact measurement technology, on the one hand, guarantees that there is no wear and tear as the beam does not affect the device. On the other hand, the device has a centring 10 mm dowel pin hole that enables fast alignment in the working chamber. Reproducible measurements can thus be achieved easily. As the measurement itself only takes fractions of a second, the focus shift can be measured, delivering a realistic picture of the process. Conventional measurement devices are much slower and thus are simply unable to detect focus shift at all.
Conclusion
More parameters than just the optical performance of the laser beam influence the reproducibility of AM parts. However, neither the material specification nor the handling of the material in the build chamber can guarantee the required narrow bandwidth of the PBF-LB process without control of the laser focal spot. There is no control without the gathering of reliable data.
The different measurement technologies offer suitable options for all use cases. Scanning slit and PPS sensors represent the entry-level of data gathering in PBF-LB systems in terms of the delivered information and investment. The newly available option to use CCD cameras for PBF-LB applications, even at higher power levels, goes a significant step further as it offers fast and easy-to-use beam profiling. Major barriers for laser beam monitoring, including time to set up and time for measurement, can thus be overcome.
The combination of new attenuation optics and CCD camera delivers a relatively low price tag, as well as a compact and lightweight design that supports the increased use of performance monitoring. Monitoring trend lines of power density enables narrower process windows and operation of the PBF-LB machine closer to its optimum specifications.
When it comes to regularly measuring the performance of the laser in the working chamber, a compact non-contact device such as the Ophir BeamWatch AM offers many advantages. Due to its short set-up and measurement times, it allows the manufacturer to produce and calibrate more PBF-LB systems in a shorter time frame. Furthermore, the manufacturer’s service team can efficiently measure PBF-LB systems in the field using the same beam profiling system as the production process does, which – once again – ensures product quality and reproducibility of the laser beam performance. From a user perspective, beam quality can be measured quickly and frequently in the production process.
No matter what option the machine manufacturer and user select, a major step towards reproducibility is to be aware that the laser beam needs to be monitored, as it has a significant impact on the reproducible quality of the produced parts.
Author
Christian Dini, Director Global Business Development
Ophir Spiricon Europe
(MKS Instruments)
Guerickeweg 7
D-64291 Darmstadt, Germany
Tel: +49 6151 708 0
[email protected]
www.ophiropt.com
LAST MONTH’S MOST-READ ARTICLES