

Using the Six Sigma method to optimise metal powder spreading in PBF-LB
In Laser Beam Powder Bed Fusion (PBF-LB), powder is applied to the build platform by a recoater unit performing a horizontal movement. Though not often the focus of research, the quality of powder layers has a significant influence on the quality of the final part, making the powder application process highly relevant to PBF-LB's productivity and reliability. A collaborative project between the Chair of Hybrid Additive Manufacturing (HAM) at the Ruhr University Bochum and the consulting firm MTS Consulting Partner has shown how the Six Sigma method can be used to improve the process of metal powder application in the PBF-LB process. [First published in Metal AM Vol. 8 No. 4, Winter 2022 | 20 minute read | View on Issuu | Download PDF]

Laser Beam Powder Bed Fusion (PBF-LB) is being used in a growing number of applications, and has taken the lead as the most visible and widely adopted of the metal Additive Manufacturing processes. Its advantages include the ability to produce small quantities of parts economically, and the ability to produce parts economically, featuring complex geometries not possible with conventional manufacturing technologies. The performance of tools for example, a common application for PBF-LB, can be increased by the implementation of cooling channels close to the contour (conformal cooling), and component weight can be reduced via topology optimisation in almost all suitable applications.
To optimise the PBF-LB process, numerous studies have been conducted which consider the energy input for melting the metal powder with the laser beam [1–3]. In contrast, the application of the powder to the build bed is rarely the focus of research, though this is also highly relevant to the productivity and quality of the PBF-LB process and the parts produced [4, 5]. Since powder layers are applied and melted iteratively, the quality of the powder layers has a significant influence on part quality. In addition, the productivity of the process can be increased by reducing the time needed for powder application.
The Six Sigma method is an established management system in industry which is used for process improvement and quality management [6]. In a Six Sigma project, five phases are carried out: Define, Measure, Analyse, Improve and Control (DMAIC). Using this systematic approach, a process can be analysed using statistically validated data and improvement achieved based on fact [7]. In this project, the Six Sigma method was applied to the powder application step of the PBF-LB process.
Define: Definition of the powder application system
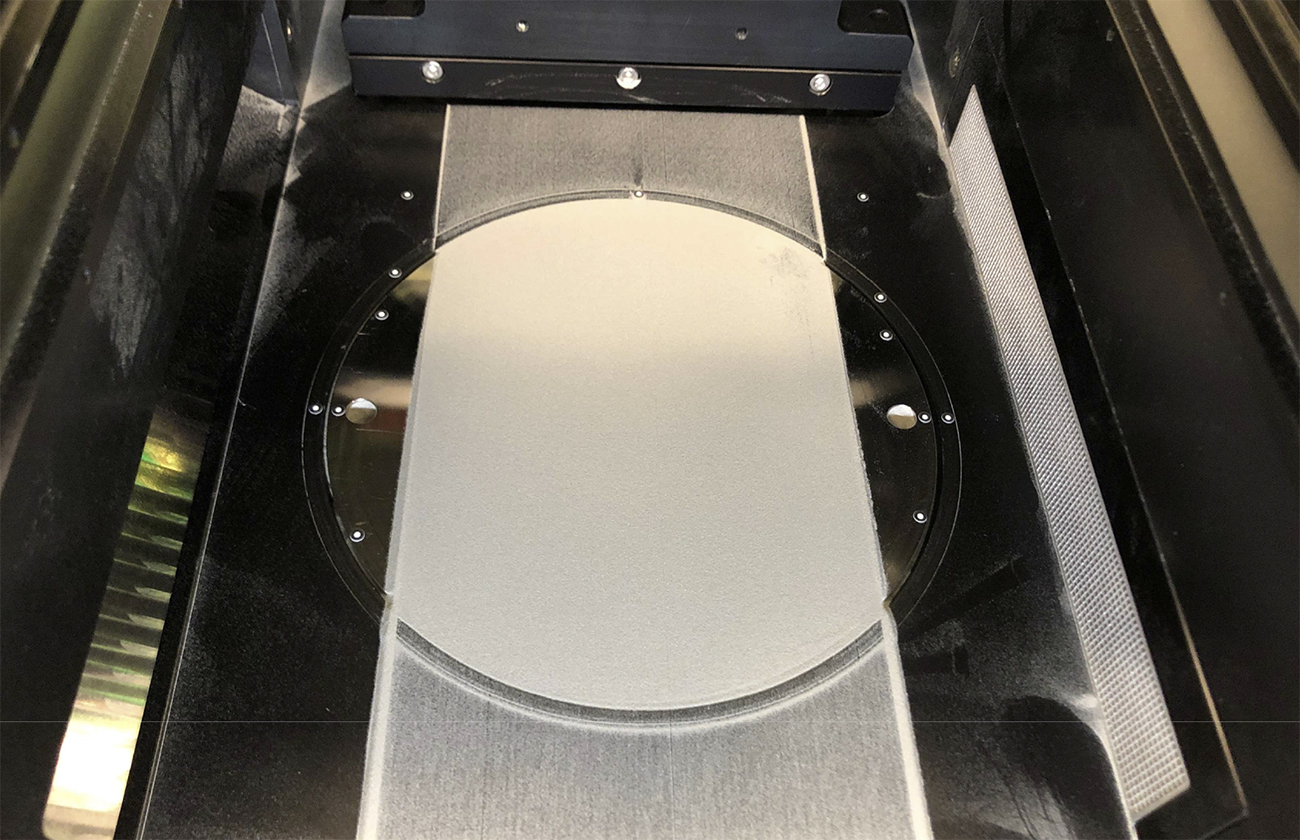
The powder application process studied in this Six Sigma project was assessed in an AconityMIDI PBF-LB machine from Aconity3D GmbH, Herzogenrath, Germany. Fig. 1 shows one powder layer applied with a 120 mm wide recoater blade.
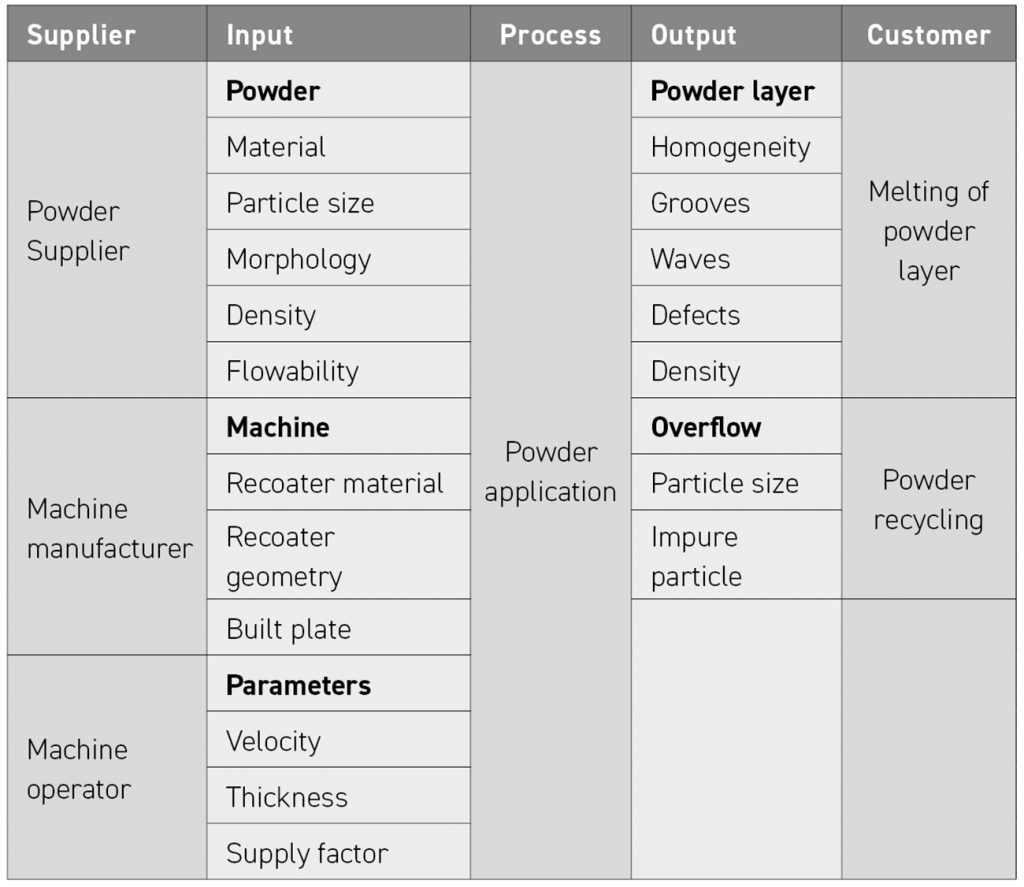
In this machine, the required amount of powder for one layer is provided by the vertical movement of a supply cylinder. The powder is applied to the build platform by the recoater unit performing a horizontal movement with a built-in recoater medium. The recoater medium can be exchanged, enabling the use of different recoater materials and geometries. The vertical movement of the build cylinder determines the height of the layer. In this investigation, a 120 mm wide powder layer with a height between 30-100 µm is applied. In the Define phase, the powder application process is described in terms of its inputs and outputs. For this purpose, a Supplier, Input, Process, Output, Customer (SIPOC) breakdown is used, illustrated in Table 1.
The variables influencing the powder application process are the powder, with its characteristic properties; the Additive Manufacturing machine and its equipment; and the process parameters which can be set on the AM machine. In this study, 316L stainless-steel powder (EN 1.4404) with a particle size distribution of 27-53 µm was used. The selection of the machine, as well as the operating parameters used, were based on the machine manufacturer’s recommendations and the judgment of the authors.
In the Analysis phase, these input parameters were examined in relation to their effect on the process result (output). The output of the powder application is the powder layer and the overflow of powder that results from the application. The customers of these results are the two subsequent process steps of melting the powder layer and the powder recycling process. The focus of this investigation was on the quality of the powder layer, which can be defined by various attributes. In the Measure phase, these attributes were defined and evaluated as measured parameters.

Measure: Measured parameters for the evaluation of powder application
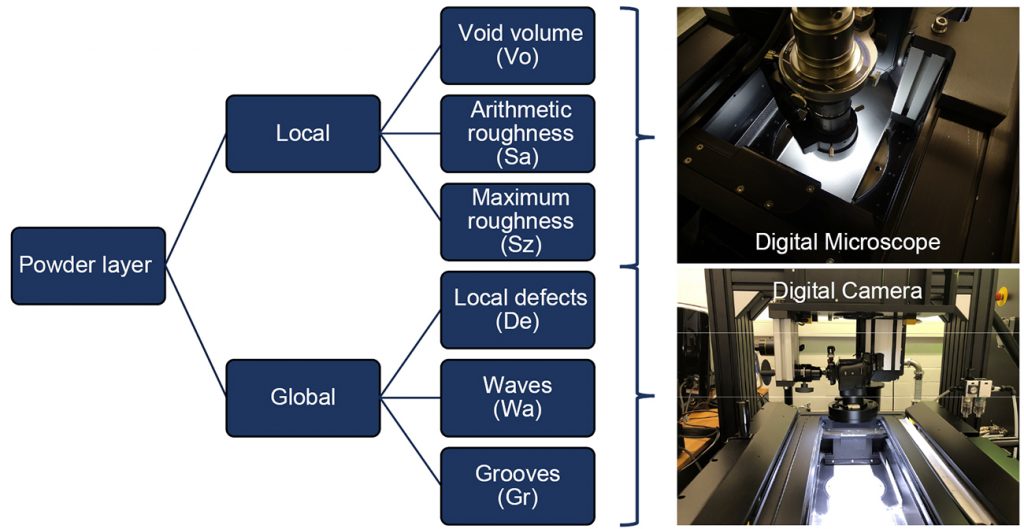
To record the quality of the powder layer, the digital microscope VHX6000 from the manufacturer Keyence Corporation, Osaka, Japan, and the optics VH-Z100R/T at 200 X magnification are used. The microscope captures a section of approximately 1.2 x 0.9 mm and is used to evaluate the local homogeneity of the powder layer. According to the principle of focus variation, a three-dimensional profile of the powder surface is measured with the microscope. Based on this height information, the surface roughness parameters arithmetic mean height (Sa) and maximum height (Sz) are determined. In addition, the volume between the measured surface and the plane which passes through the highest point of the profile parallel to the averaged surface is determined [8]. This void volume (Vo) also describes the roughness of the powder layer.
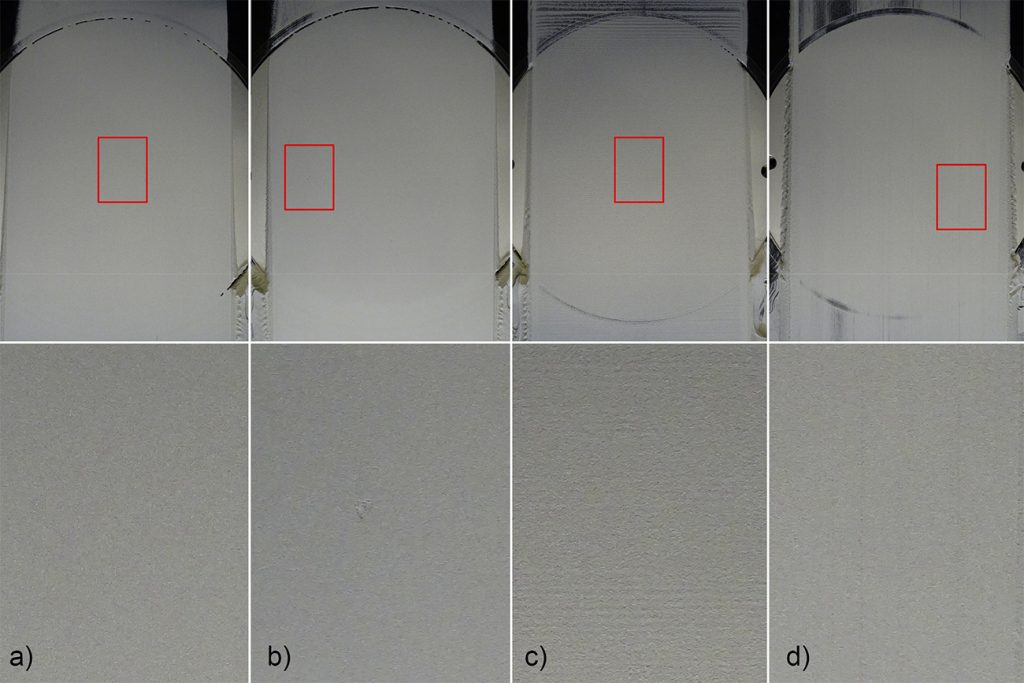
For all three measured variables, a small value stands for a homogeneous powder bed with low surface roughness. Additionally, images of the powder layer are taken with the digital camera DSC-HX400V from Sony, Tokyo, Japan. These images are examined regarding the defect characteristics local defects (De), waves (Wa) and grooves (Gr). These defect characteristics are shown as examples in Fig. 2. Fig. 3 gives an overview of the two measuring systems and the parameters they measure.
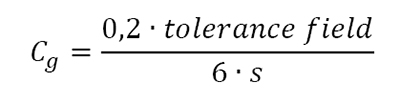
The capability of each measurement system for each of the measurands (the property to be measured) was ensured by a measurement system analysis (MSA). An MSA type 1 was carried out for the quantitative measurement parameters Vo, Sa and Sz. Here, the empirical standard deviation (s) from twenty-five measurements of the same powder layer was compared with a defined tolerance field. The tolerance field was defined based on bad and good powder layers. The potential measurement capability index Cg, determined according to the following equation, gives information about the repeatability of the measurement.
The qualitative measurands De, Wa and Gr were investigated by the method of attribute agreement. For this purpose, image recordings of twenty-five powder layers containing one or more of the defect characteristics were independently evaluated by three examiners. The evaluation of the images was randomised and repeated. From these evaluations, the percentage agreement of the three examiners was determined for each defect characteristic. The Cg-values and the agreement of the examiners are listed in Table 2.
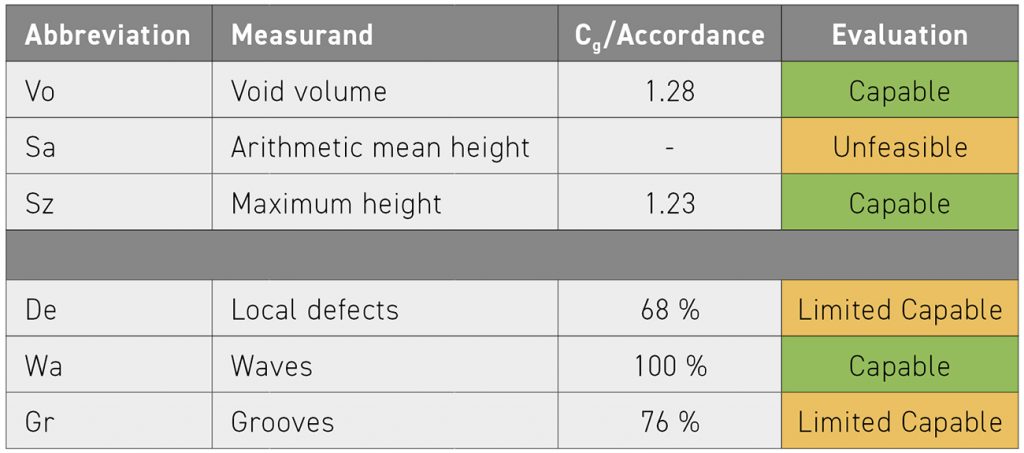
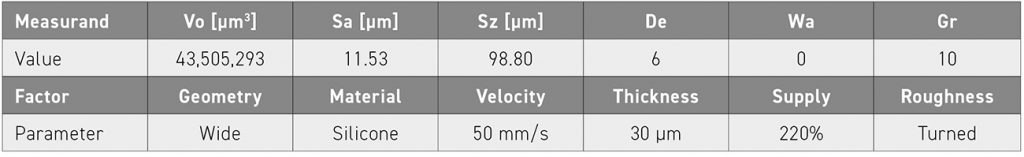
The quantitative measured parameters Vo and Sz can evaluate the powder application due to their Cg-value of more than 1.00. No Cg-value can be determined for the measurand Sa, as the resolution of this measurand is not sufficient. Waves are detected with an agreement of 100%. The agreement of local defects and grooves, on the other hand, is only 68–76%. Accordingly, defects and grooves can be identified repeatedly, but the certainty that they are detected correctly is significantly lower than for waves. At the end of the measure phase, the current process performance is recorded using the usual equipment and the usual process parameters (see Table 3). Here, the result of the measured variable Sa is also given, as this is an established parameter for describing the surface quality.

Analysis: Analysis of the powder application system
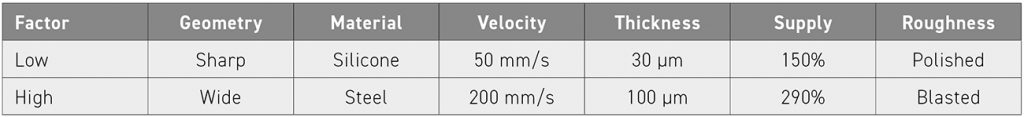
The powder application system is analysed by a statistical design of experiments (DoE). Here, the influencing variables (inputs) – geometry and material of the recoater, velocity, layer thickness, supply factor and roughness of the build platform – take on different settings. Each of the six factors is set to two different factor levels in this study. For the geometry of the recoater, a sharp version with a small contact area and a wide version with a large contact area to the powder bed are used. The recoater materials were a silicone with a hardness of 33 ShA and a tool steel. Factor settings are determined for the velocity of the recoater, the layer thickness and the supply factor based on previous studies [5,9,10]. Different surface roughnesses are generated on the build platform by a polishing process with 3 µm diamond particles and blasting with 180–250 µm corundum. Table 4 summarises the factor settings described.
A partial factorial, two-level experimental design was carried out according to scheme 26-2. This resulted in sixteen trials, realised in randomised order. Each trail comprised the evaluation of ten successively applied powder layers.
Local analysis
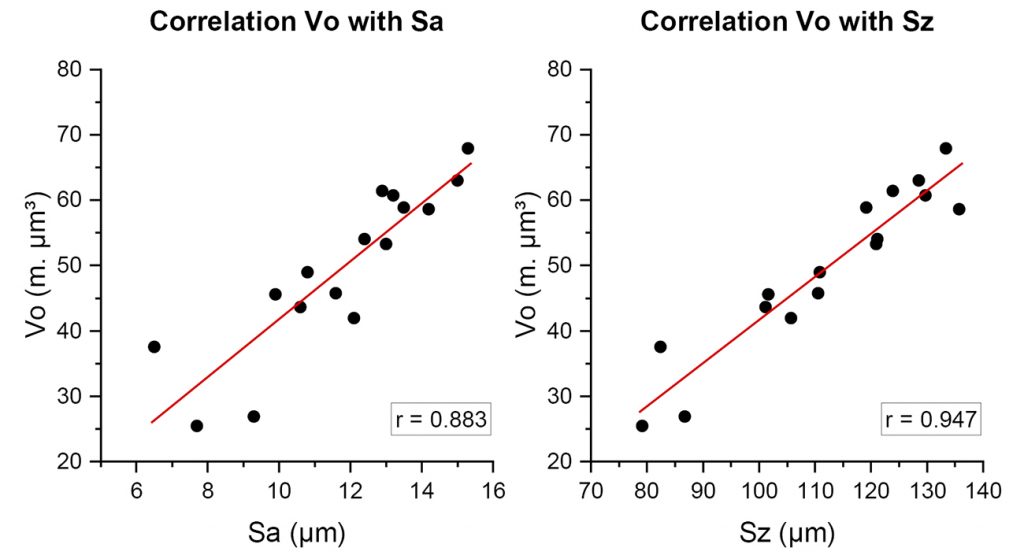
The mean values of the measurands Sa and Sz show a significant correlation with the measurand Vo, with correlation coefficients between 0.88-0.95 (see Fig. 4).
Due to this correlation, the experiment is evaluated based on the measured parameter Vo, which has the strongest Cg-value according to the MSA. To describe the target parameter Vo, a linear regression model is generated according to the principle of forward selection at a significance level of 5%. This model has a coefficient of determination (R2) of 77.06% and is described by the following equation. Here G stands for the recoater geometry, M for the recoater material, V for the recoater velocity, T for the layer thickness and R for the roughness of the build platform:
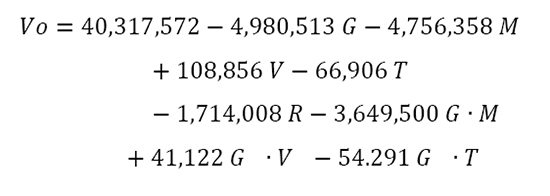
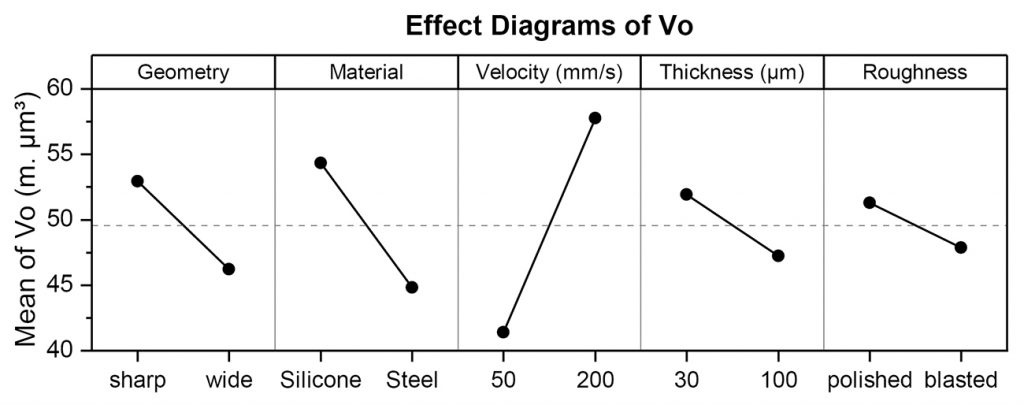
This model equation provides the effects of the factors on the target parameter Vo. In the Pareto diagram (Fig. 5), the standardised effects are shown in order of magnitude. The effect diagrams in Fig. 6 illustrate the directions of the effects.
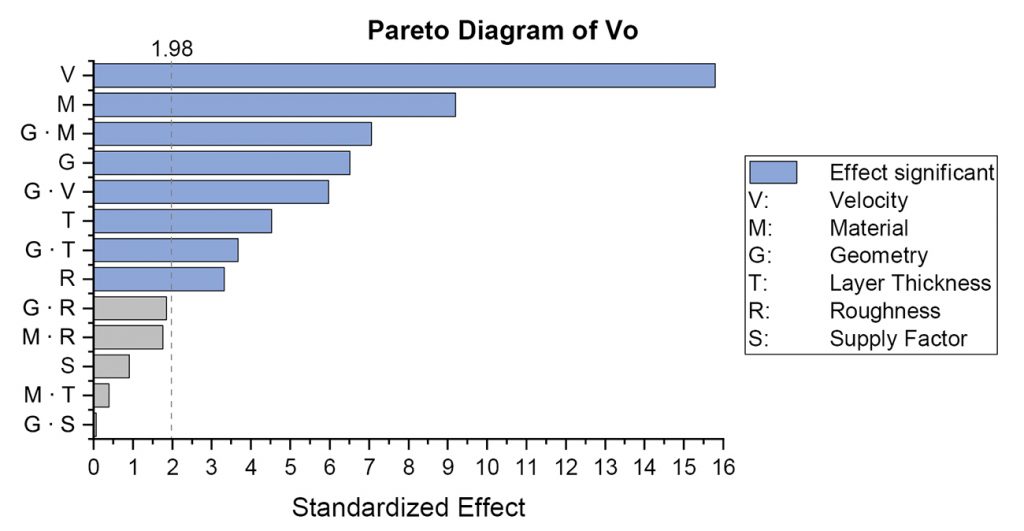
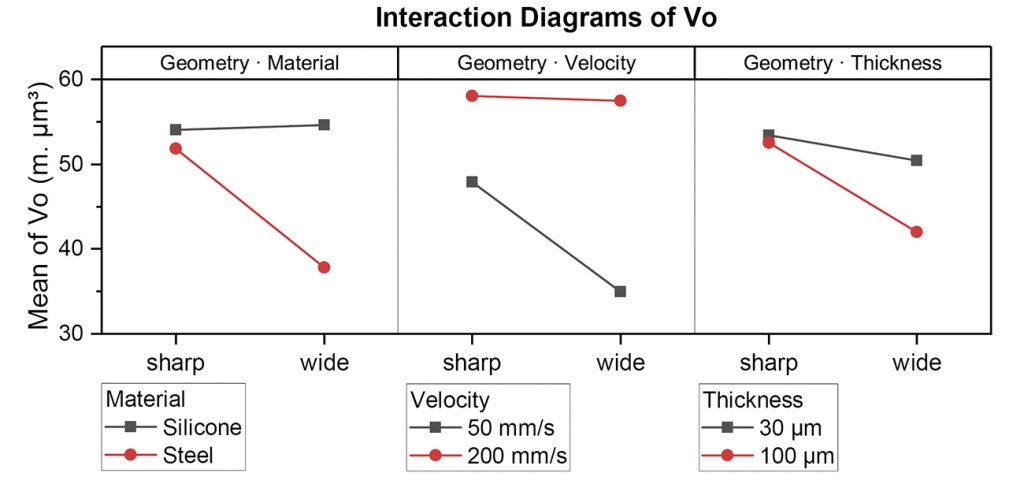
The gradient of the effect lines in Fig. 6 shows the effect of the respective factor setting on the target value. The recoater velocity has the greatest effect on Vo. At low velocity, more homogeneous powder layers are measured on average than at high velocity. A recoater made of steel, in contrast to one made of silicone, leads to more homogeneous powder layers. The same applies to a wide recoater geometry compared to a sharp one. The effects of the layer thickness and the roughness of the build platform are smaller than the other effects. A large layer thickness and a rough (blasted) build platform favoured a homogeneous powder application in the experiment. The supply factor has no significant effect on the measurand Vo. In addition to the effects of the individual factors, interaction effects occurred. These become apparent through the different effects of the recoater geometry depending on the material, velocity and powder layer thickness. In Fig. 7, the interaction effects can be interpreted based on the different gradients of the effect lines.
The effect of the recoater geometry is significantly greater with recoaters made of steel than with those made of silicone. In addition, the effects show different directions. On average, the smallest void volume is achieved with the wide recoater made of steel. The geometry of the recoater hardly shows any effect at a high recoater velocity. At a low velocity, on the other hand, more homogeneous powder layers are achieved when using the wide geometry. Layer thickness amplifies the effect of the recoater geometry, as there is a stronger effect with greater layer thicknesses.
Global analysis
When evaluating the qualitative parameters De, Wa and Gr, the number of layers in which the respective defect characteristic occurred is considered. There is no significant correlation between the local defects and factors (inputs). Waves occur as a function of the recoater velocity and the recoater used. The diagrams in Fig. 8 show the number of layers in which waves occurred for each trail, in relation to the recoater’s velocity, material and geometry.
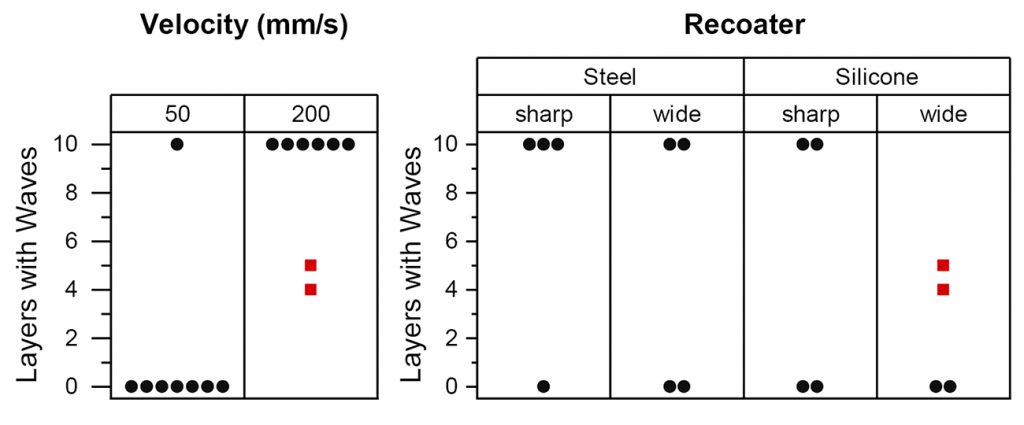
The number of layers with waves is significantly lower at the recoater velocity of 50 mm/s than at 200 mm/s. At the low recoater velocity, no waves occur except in one trail. Under the high velocity, except for two trials (marked red), all trials show waves in each of the ten layers. In these two trials, the application was performed with a wide silicone recoater. Since these trials have a large void volume, there is a possibility that the roughness and inhomogeneity of the powder layer is covering up the waves. Grooves also shows a dependence on the recoater velocity and the recoater used. Analogous to waves, in Fig. 9 the number of layers with grooves is shown for each of the trials in relation to the velocity and the recoater.
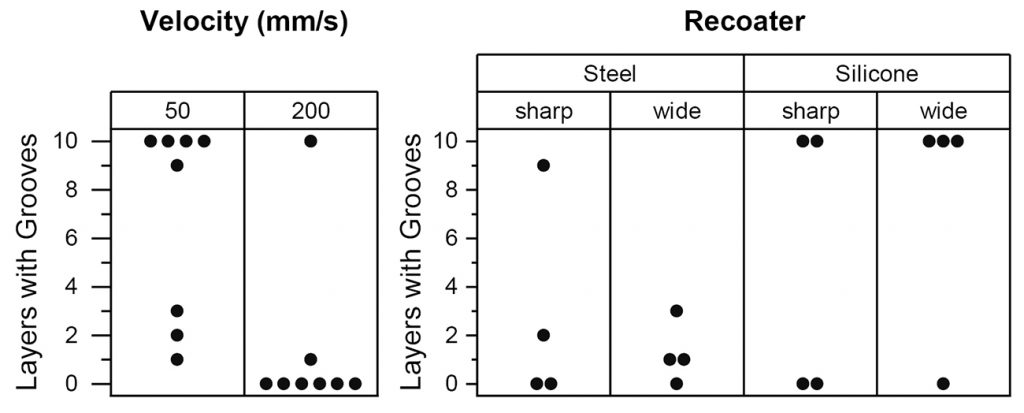
At the recoater velocity of 50 mm/s, significantly more layers with grooves occur than at 200 mm/s. A comparison of the different recoaters shows that fewer grooves occurred using a recoater made of steel than one made of silicone. In particular, the steel recoater with the wide geometry generated the fewest grooved layers. A comparison of the individual trials showing the number of grooves, number of waves and the void volume is given in Fig. 10.
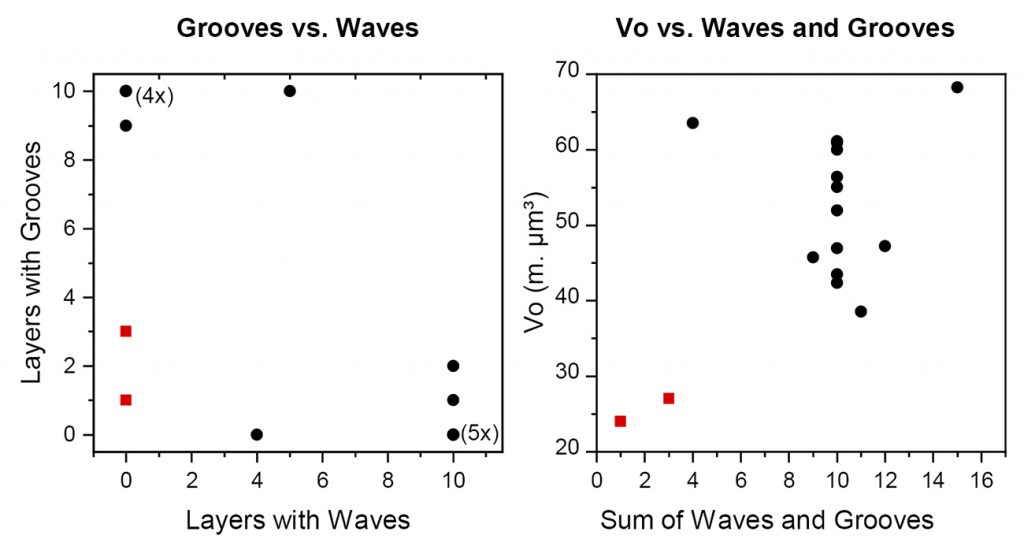
The representation of the grooves against the waves shows that two trials have no waves and only a few grooves (marked in red). The consideration of the sum of waves and grooves in relation to the mean void volume shows that, in these two trials, significantly more homogeneous powder layers were achieved. Both trials were carried out at a recoater velocity of 50 mm/s using the wide steel recoater.

Improve: Optimisation of powder application
In the Improve phase, the findings of the Analysis phase are used to optimise the process. The local quality of the powder coating is highest at a recoater velocity of 50 mm/s, using a wide steel recoater. In addition, no waves and only a few grooves are generated with these settings. In order to verify the improvement of the powder application process, a trail is now carried out with the appropriate settings for the influencing variables. The results of this trail are compared with those of the current process performance in Table 5.
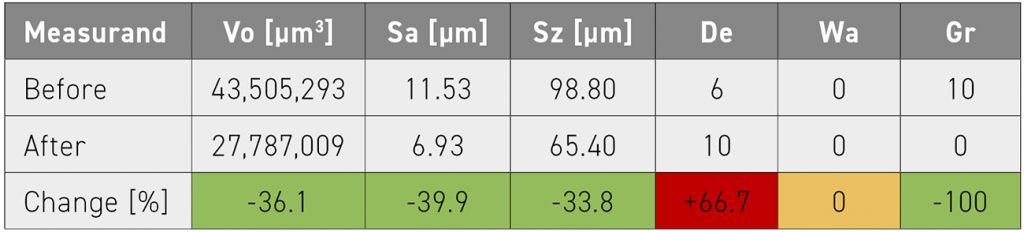
Based on the measured parameters, the quality of the powder layer was significantly improved at the same recoater velocity. This applies particularly to the local homogeneity of the powder layer, which is described by the measured parameters Vo, Sa and Sz. The increase in local defects can be explained by the fact that small local defects are more noticeable in a homogeneous powder layer than in a less homogeneous one. Local defects are less critical compared to periodic defects such as grooves or waves, as they do not extend over the entire powder bed. The occurrence of grooves could be eliminated with the modified settings.
Control: Project documentation
The Control phase serves to ensure the improvement of the process. For this purpose, a documentation of the project was created that summarises the results of the analysis phase. This includes a control plan with recommendations for avoiding defect characteristics and increasing local homogeneity. Based on the described regression model, it can be predicted which factor settings lead to which quality of the powder application. At the end of the project, the measurement data and the documentation were handed over to the person responsible for the AM machine to enable the setting of the ideal powder application parameters.
Summary and outlook
This study shows how the powder application process step was successfully optimised using the Six Sigma method. The process, divided into the five DMAIC phases, represented a systematic and structured approach. Powder application was treated as a separate process, the result of which is described by validated measurands. The effect of the influencing variables on this process was analysed with statistical methods, whereby knowledge about the process was obtained.
Based on these facts, an improvement in the quality of the powder application was achieved and ensured in the long term. With regard to the economic efficiency of the PBF-LB process, it is important to increase productivity. This can be realised by a shorter application time and, thus, a higher recoater velocity.
Since increasing the recoater velocity leads to a decrease in the quality of the powder layer, it must be investigated how high the quality of the powder layer has to be in order to produce components with acceptable quality. Future investigations on this topic are planned. In this context, other powder materials, as well as other application systems, will also be investigated. In line with these plans, a powder test rig is currently being developed.
Authors
Tim Robert Brocksieper
Chair of Hybrid Additive Manufacturing, Ruhr-University Bochum, Bochum, Germany
[email protected]
Nick Hantke
Chair of Hybrid Additive Manufacturing, Ruhr-University Bochum, Bochum, Germany
[email protected]
Prof Dr-Ing Jan T Sehrt
Chair of Hybrid Additive Manufacturing, Ruhr-University Bochum, Bochum, Germany
[email protected]
Dr Dietmar Stemann
MTS Consulting Partner, Werl, Germany
[email protected]
References
[1] C D Boley, S A Khairallah, A M Rubenchik, Calculation of laser absorption by metal powders in additive manufacturing, Appl. Opt. 54 (2015) 2477–2482. https://doi.org/10.1364/AO.54.002477.
[2] A V Gusarov, J -P Kruth, Modelling of radiation transfer in metallic powders at laser treatment, International Journal of Heat and Mass Transfer 48 (2005) 3423–3434. https://doi.org/10.1016/j.ijheatmasstransfer.2005.01.044.
[3] R Mertens, S Dadbakhsh, J van Humbeeck, J -P Kruth, Application of base plate preheating during selective laser melting, Procedia CIRP 74 (2018) 5–11. https://doi.org/10.1016/j.procir.2018.08.002.
[4] S E Brika, M Letenneur, C A Dion, V Brailovski, Influence of particle morphology and size distribution on the powder flowability and laser powder bed fusion manufacturability of Ti-6Al-4V alloy, Additive Manufacturing 31 (2020). https://doi.org/10.1016/j.addma.2019.100929.
[5] V Seyda, Werkstoff- und Prozessverhalten von Metallpulvern in der laseradditiven Fertigung, Springer Vieweg, Berlin, Heidelberg, 2018.
[6] J Antony, R Snee, R Hoerl, Lean Six Sigma: yesterday, today and tomorrow, IJQRM 34 (2017) 1073–1093. https://doi.org/10.1108/IJQRM-03-2016-0035.
[7] ISO 13053-1:2011-09, Quantitative methods in process improvement: Six Sigma – Part 1: DMAIC methodology.
[8] A Mussatto, R Groarke, A O’Neill, M A Obeidi, Y Delaure, D Brabazon, Influences of powder morphology and spreading parameters on the powder bed topography uniformity in powder bed fusion metal additive manufacturing, Additive Manufacturing 38 (2021). https://doi.org/10.1016/j.addma.2020.101807.
[9] C N Hulme-Smith, V Hari, P Mellin, Spreadability Testing of Powder for Additive Manufacturing, Berg Huettenmaenn Monatsh 166 (2021) 9–13. https://doi.org/10.1007/s00501-020-01069-9.
[10] Z Snow, R Martukanitz, S Joshi, On the development of powder spreadability metrics and feedstock requirements for powder bed fusion additive manufacturing, Additive Manufacturing 28 (2019) 78–86. https://doi.org/10.1016/j.addma.2019.04.017.
LAST MONTH’S MOST-READ ARTICLES