

The challenge of grain size:
X-ray powder diffraction analysis of parts made by metal AM
X-ray powder diffraction (XRPD) has long been a powerful tool in metallurgy, but its unsuitability for parts with large grain sizes has made its use for the analysis of metal additively manufactured parts a challenge. In this article, Dr Scott Speakman, Malvern Panalytical, reports on a study in which specimens of soft magnetic Fe-Si steel were made by PBF-LB using a variety of raster and annealing strategies to produce specimens with large grain sizes. The X-ray diffraction data collected illustrates the tell-tale signs of poor crystallite sampling statistics. Speakman presents some strategies for recovering data fidelity with conventionally available options. [First published in Metal AM Vol. 8 No. 2, Summer 2022 | 25 minute read | View on Issuu | Download PDF]
X-ray powder diffraction (XRPD) has been a powerful tool in metallurgy for over 100 years [1,2]. Despite the misleading name, X-ray powder diffraction is used for analysis of more than just powder: it is routinely used for the non-destructive analysis of metal sheet, wire, and parts. XRPD is a well-established method for production control using phase identification, phase quantification (such as retained Austenite), texture and residual stress analysis of manufactured parts. Given its credentials as an established non-destructive characterisation method, X-ray powder diffraction should be a powerful solution for the process development, optimisation of parts, and certification of production machines that is needed for the widespread commercialisation of Additive Manufacturing [3].
X-ray powder diffraction has been used for research studies for analysis of additively manufactured parts, primarily for phase identification during alloy development and residual stress analysis [4, 5,10]. However, this method is not universally used in process studies or commercialisation strategies because Additive Manufacturing can routinely produce parts with grain sizes 100 µm and larger [6]. The ideal specimen for X-ray powder diffraction analysis has a crystallite size less than 1 µm. Therefore, the large grain sizes that can be produced by Additive Manufacturing limit the use of XRPD as a process optimisation and control tool.

For this study, specimens of soft magnetic Fe-Si steel were made by Laser Beam Powder Bed Fusion (PBF-LB) using a variety of raster and annealing strategies. These processes produced specimens with large grain sizes from 100 to > 500 µm. Such grain sizes are unfavourable for X-ray powder diffraction analysis, which works best with specimens that have < 10 µm grain sizes. X-ray diffraction data were collected using several different strategies to illustrate the signs of poor crystallite sampling statistics, and some strategies for recovering data fidelity with conventionally available options were explored.
Understanding the problem
The problem of large grain sizes is well-known in X-ray powder diffraction analysis. It is often called ‘particle statistics’ [7], though the term ‘crystallite statistics’ is more accurate [8]. X-ray powder diffraction assumes that a statistically sufficient number of crystallites are irradiated by the X-ray beam to produce an accurate measurement of diffracted intensity and a smooth diffraction peak that can be fit and analysed by software. Achieving adequate crystallite statistics is difficult because only a small fraction of crystallites in a specimen will be properly oriented to diffract. A sample with 1 µm average crystallite size will have 38,200,000,000 crystallites within the irradiated volume; but only 38,000 (i.e. 0.0001%) of the crystallites will be properly oriented to diffract at any given Bragg angle [8].

Poor crystallite statistics will affect the precision and accuracy of intensity measurements, the precision of peak position measurements, and the precision of peak width measurements.
Fig. 2 shows the standard error in intensity calculated as a function of crystallite size for diffractometers with differing goniometer radii (ie the distance from the source-to-sample and the distance from sample-to-detector). The standard error is calculated as 2.3σ = 2.3 √Ns/Ns *100, where Ns is the number of diffracting crystallites for a given diffraction peak [8]. The fraction of crystallites contributing to the measured intensity, Ns, is calculated using equations derived by Jenkins and Snyder [15]. Amongst various factors, Ns depends on goniometer radius, the take-off angle of the incident X-rays, and the size of the receiving slit aperture.
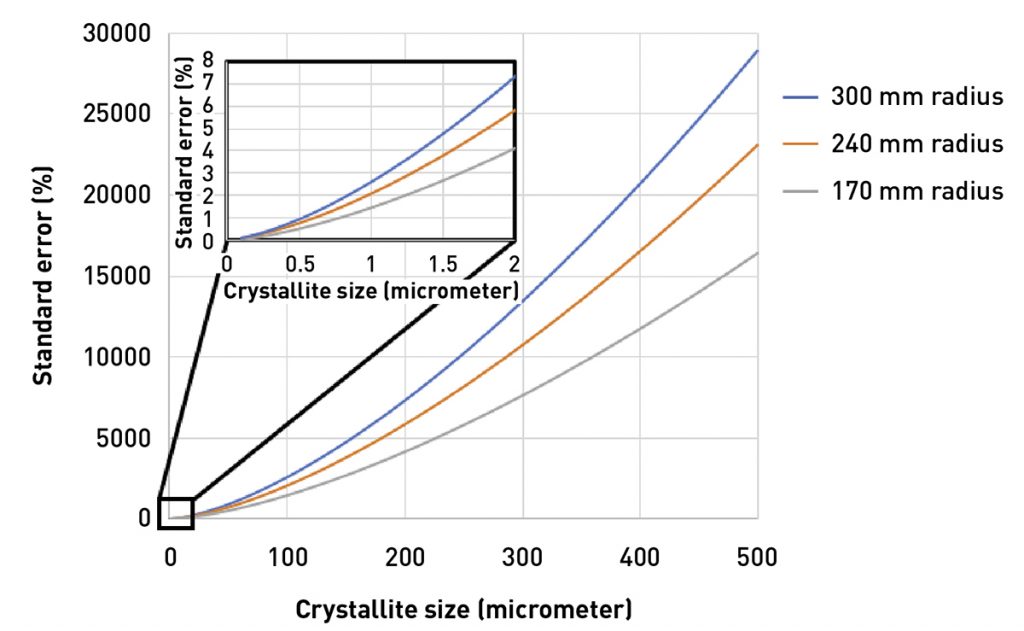
As seen in Fig. 2, even a specimen with 1 µm crystallite size will produce > 1% standard error. As calculated by Davis et al [8], there should be ~53,000 diffracting crystallites in a specimen in order to produce standard error less than 1% for the intensity of a given diffraction peak. A specimen with 1 µm crystallite size will contain only 38,000 diffracting crystallites in the standard irradiated volume. This is still much better than a specimen with a 40 µm crystallite size, which will contain only twelve diffracting crystallites and can produce a > 100% standard error in the measured peak intensity.
Fig. 2 not only illustrates that standard error increase quickly with crystallite size, but also that a longer goniometer radius also increases the standard errors in measuring peak intensity. While a shorter radius will improve crystallite statistics, it must be balanced against the optics and detector to maintain suitable angular resolution at that radius.
Poor crystallite statistics can also produce inaccurate peak intensity measurements because X-ray powder diffraction assumes that every diffraction peak is the product of diffraction from a statistically equivalent number of crystallites. This assumption is not valid in a specimen with poor crystallite statistics [11,12]. Consequently, any analysis that relies on accurate peak intensities – such as phase quantification and texture analysis – will fail.

The above numbers are calculated for a 20 mm3 irradiated volume that is produced by a conventional powder diffractometer using a half degree fixed divergence slit and 13 mm beam width to analyse a SiO2 material. It has become popular to analyse manufactured parts with microfocus sources that produce ≤ 0.4 mm diameter X-ray beam. While these sources provide improved spatial resolution, the number of irradiated grains is significantly diminished. The crystallite statistics can be improved by combining a large area detector with the microfocus source, which increases the fraction of the Debye diffraction ring observed, effectively increasing the receiving slit aperture [9]. However, when the grain size is 40 µm the maximum number of crystallites irradiated is still limited to ~375, which will not produce sufficient crystallite statistics for accurate analysis.
The effect of poor crystallite statistics on peak intensity is well-documented [11,12]. Less well-documented is how poor crystallite statistics also compromise the accuracy of peak position measurements, which will produce errors in lattice parameter and residual stress calculations. This problem is illustrated in Fig. 3, which compares the 2D and 1D diffraction patterns of SiO2 specimens with 8 and 27 µm average crystallite size. The 2D diffraction pattern shows a segment of the Debye diffraction ring. The ideal powder specimen produces a Debye diffraction ring that appears as an arc of continuous and even intensity. The 2D diffraction pattern from a specimen with large crystallite size shows individual diffraction spots, rather than an arc of intensity. Each spot in the 2D diffraction pattern essentially represents diffraction from a crystallite. The 2D diffraction pattern can be converted into an equivalent 1D diffraction pattern by integrating the data in arcs corresponding to Debye rings.
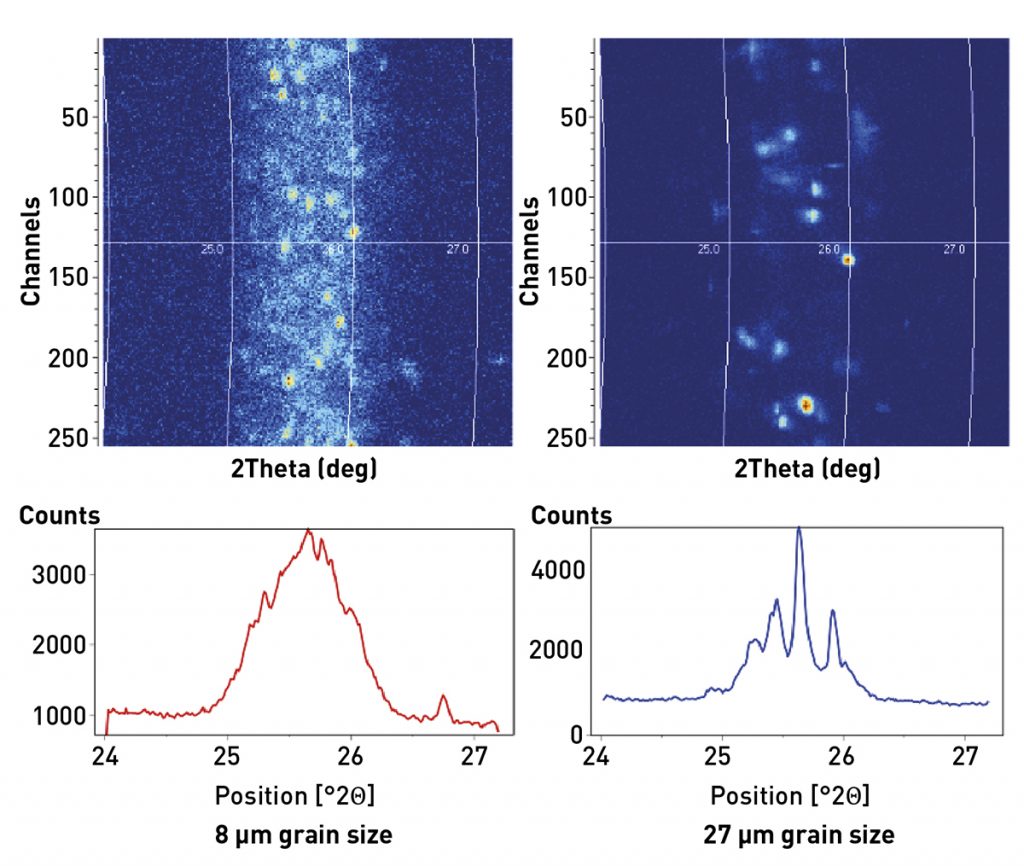
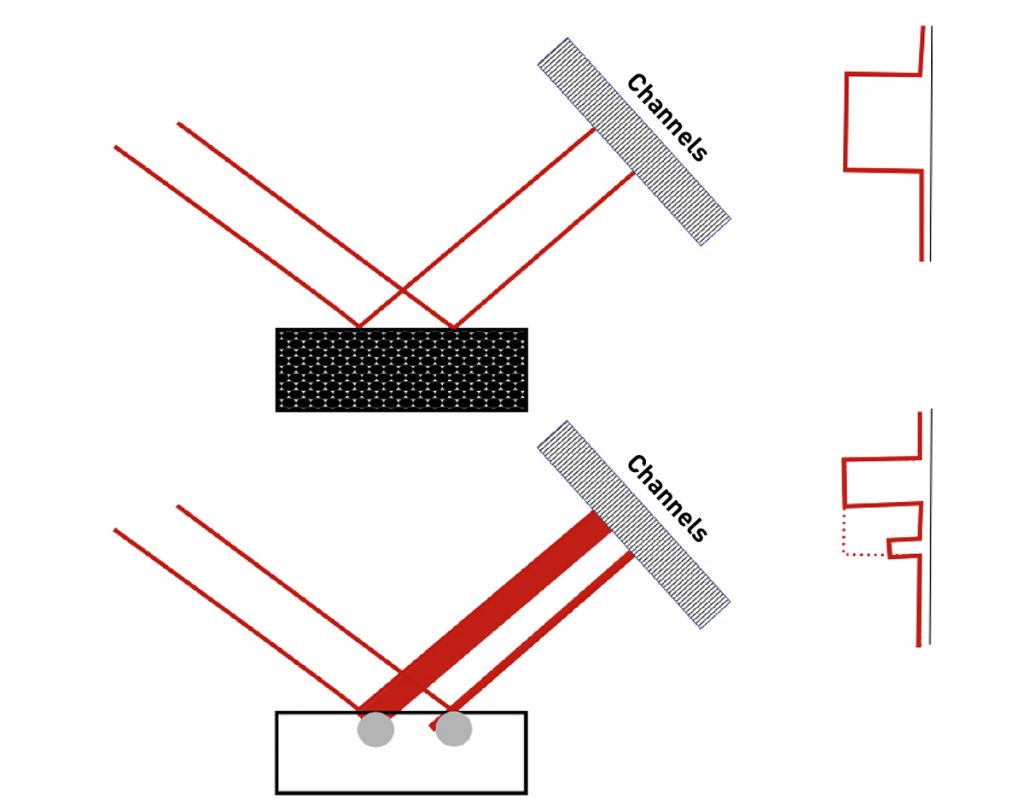
Even though the spots seen in the diffraction rings in Fig. 3 are all produced by diffraction from a single Bragg angle, the diffraction spots appear to be distributed across a range of 2theta values. This occurs because the X-ray beam footprint has a finite length on the sample. This footprint is imaged by the position sensitive detector, as illustrated in Fig. 4. Crystallites in different positions of the footprint will appear to diffract at different 2theta values. The divergence of the incident X-ray beam will also contribute to the peak width and may be affected by the distribution of diffracting crystallites at different rocking angles within the irradiated volume. This effect can be reduced by using a smaller incident X-ray beam, which will adversely affect the crystallite statistics. It can also be reduced by using a parallel-plate collimator with small angular aperture.
The specimen with 8 µm crystallite size produces a diffraction ring of overlapping spots in the 2D diffraction pattern. When the 2D pattern is integrated into an equivalent 1D diffraction pattern, it produces a diffraction peak with a standard and easily characterized shape. The spread of the intensity distribution across a 2theta range is well-understood and readily modelled with profile fitting software [13], allowing the peak position to be accurately determined to be 25.67° 2theta. In contrast, the specimen with 27 µm crystallite size produces discrete diffraction spots spread over a 2theta range. Each different crystallite within the beam footprint and with a different orientation produces a spot at a slightly different angle because of the divergence of the X-ray beam. When this ‘spotty’ diffraction pattern is converted into an equivalent 1D pattern, a series of sharp spikes of intensity is produced. It is impossible to calculate an accurate diffraction peak position from these data.
Current solutions
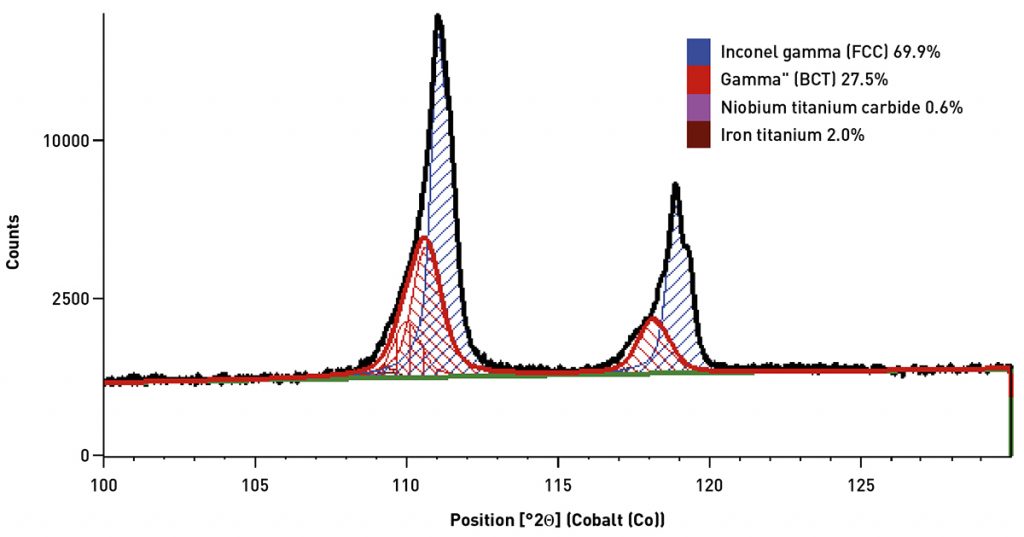
Despite the challenges of crystallite statistics, X-ray powder diffraction has been successfully used as a research tool for analysis of additively manufactured (AM) parts, such as the determination of γ’ and γ’’ precipitates in Inconel 718 [4, 5]. In a previous study [10], XRPD was used to study the variation of phase composition in feed powder and parts as excess powder was recovered and recycled into the powder hopper between successive builds. As shown in Fig. 5, X-ray powder diffraction was able to clearly distinguish the diffraction peaks of the face-centred cubic (FCC) Inconel 718 gamma phase and the body-centred tetragonal (BCT) γ’’ phase. While XRF analysis indicated that chemical composition did not vary, quantitative XRPD analysis revealed that parts had significantly more γ’’ phase than the powder and that the phase composition of both the recovered powder and parts varied slightly between builds. This study was successful partially because the grain size of the Inconel 718 was sufficiently small to provide adequate particle statistics.
Traditional methods to improve crystallite statistics of a powder sample include grinding the specimen to a small particle size, sieving the sample with 325 or better mesh, and repacking and remeasuring the powder specimen multiple times [11]. None of these techniques are suitable for AM parts. Spinning or oscillating the specimen during data collection can also improve crystallite statistics, but this is not suitable for many AM parts that are large or have complex shapes.

Other conventional techniques, available on most diffractometer platforms, that can be successful in improving particles statistics, include:
- Using a wider divergence slit to increase the irradiated area and the rocking angle of crystallites that will diffract (though Davis et al argue that the take-off angle is more important than the divergence slit in determining the rocking angle) [8]
- Wobbling the sample, using a wobble scan mode, or using the linear (1D) or area (2D) detector in scanning mode to bring more crystallites into diffraction orientation [8]
- Using a smaller wavelength of X-rays, such as using a Mo anode X-ray tube instead of a Cu anode X-ray tube, to increase the penetration depth and therefore the irradiated volume [11]
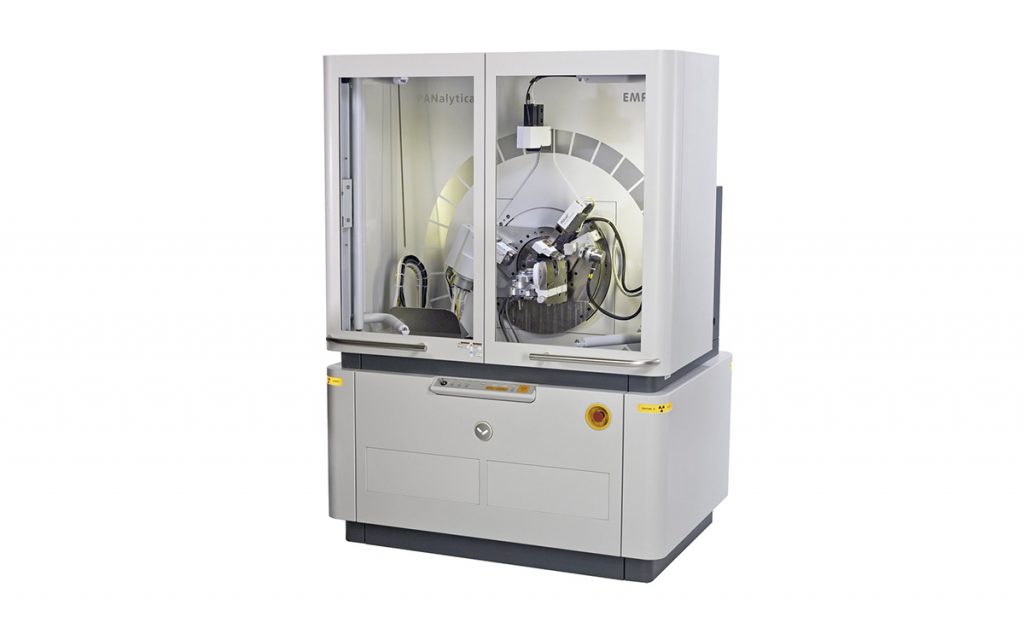
To demonstrate the effectiveness and limitations of these approaches, X-ray powder diffraction data were collected from coupons of Fe-3 wt.% Si soft magnetic steel built using Laser Beam Powder Bed Fusion. Details of the scan strategies and microstructure analysis were published by Haines et al [14]. XRPD data were collected using a Malvern Panalytical Empyrean diffractometer with Co anode X-ray tube, Bragg-Brentano HD incident-beam optic, and GaliPIX detector. Fig. 6 compares the diffraction patterns of Fe-3 wt.% Si specimens additively manufactured with the longitudinal raster scan strategy as-fabricated, annealed in flowing argon at 1000°C for 5 min and for 1 h, and annealed in H2 at 1000°C for 4 h. The as-fabricated sample shows a single diffraction peak, consistent with ferritic BCC phase. Note that, as with most powder diffractometers, each diffraction peak actually consists of a peak doublet due to the presence of characteristic K-alpha1 and K-alpha2 wavelength X-rays. The samples annealed in Ar show two diffraction peaks, indicating phase separation or another effect.
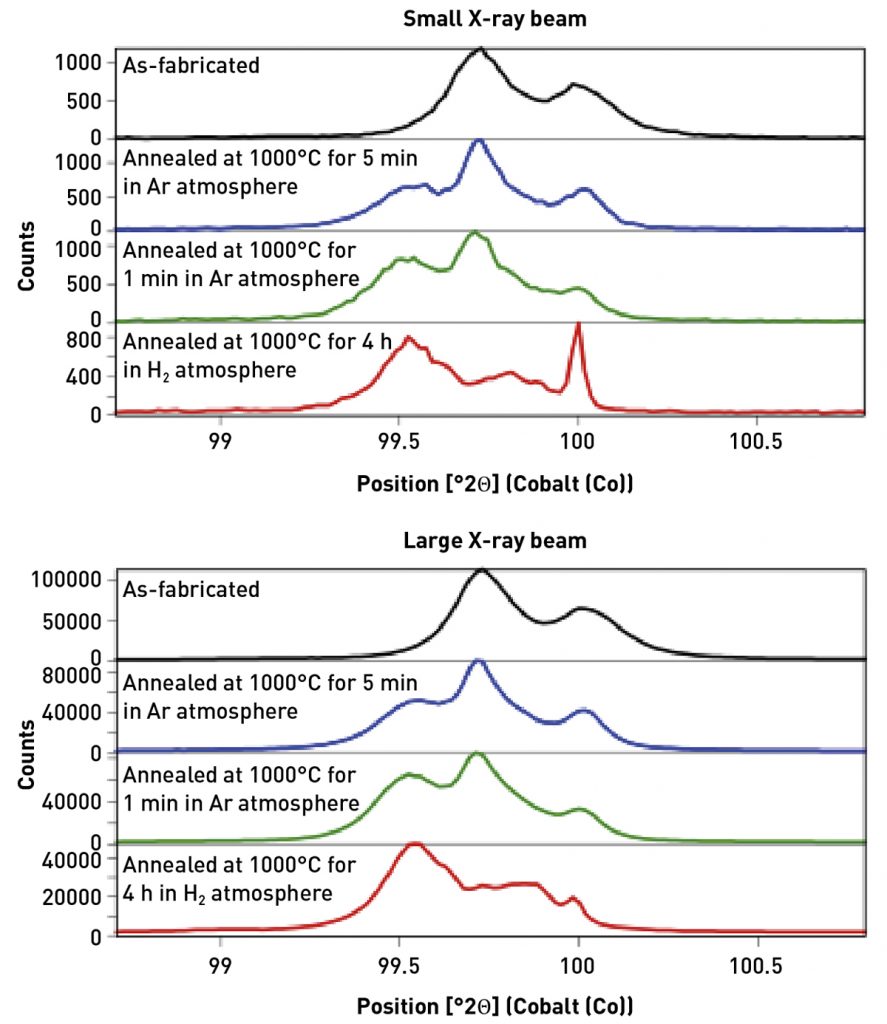
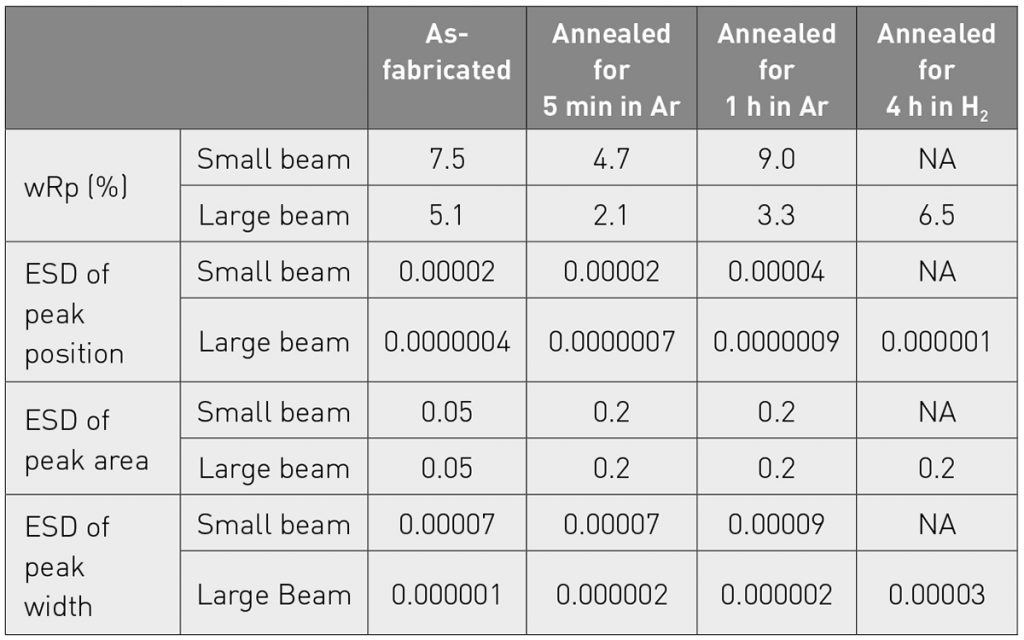
All samples have a grain size that is larger than optimal. The as-fabricated sample has ~ 100 µm average grain size, the samples annealed in Ar have ~ 200 µm average grain size, and the sample annealed in H2 has a > 500 µm average grain size. These data were collected using two different X-ray beam sizes: a small beam utilizing 1/16° divergence slit and 2 mm mask, which produces an irradiated footprint of 0.5 x 9 mm; and a large beam using a half degree divergence slit and 20 mm mask that produces an irradiated footprint of 4.5 x 27 mm. Data from both configurations were collected with the detector in stationary mode. The benefits of the larger X-ray beam can be quantified when the diffraction data are profile fit using a pseudo-Voigt peak shape. Table 1 compares several parameters that evaluate the goodness of the fit, such as the weight residual of the fit and the estimated standard deviation (ESD) of the peak position and intensity. While these parameters do not provide the true precision of the measurement, they are a useful tool for evaluating how well the diffraction data conform to the standard peak models. Data collected with the larger X-ray beam consistently provide better residuals and ESDs.
The improvement is most readily noticeable in data from the specimen annealed in H2. When analysed with a small X-ray beam, the diffraction data exhibits the ‘spotty’ peak error associated with poor crystallite statistics. This error makes it difficult, possibly impossible, to accurately analyse the data. When the same specimen is measured using the large X-ray beam, the diffraction peaks are still non-ideal but can now be fit and semi-quantitatively analysed.
The larger X-ray beam improves the crystallite statistics and resulting data; but a larger X-ray beam is not always a viable solution, especially when analysis requires spatial resolution of regions of interest. In cases where the X-ray beam must be smaller, then a scanning detector mode can also be used to improve the crystallite statistics.
When a linear (1D) or area (2D) position sensitive detector is used in scanning mode, then the effective crystallite rocking angle is increased, substantially increasing the number of crystallites contributing to the diffraction peak. This is effectively using the rocking (i.e. wobble) strategy recommended by Davis et al [8].
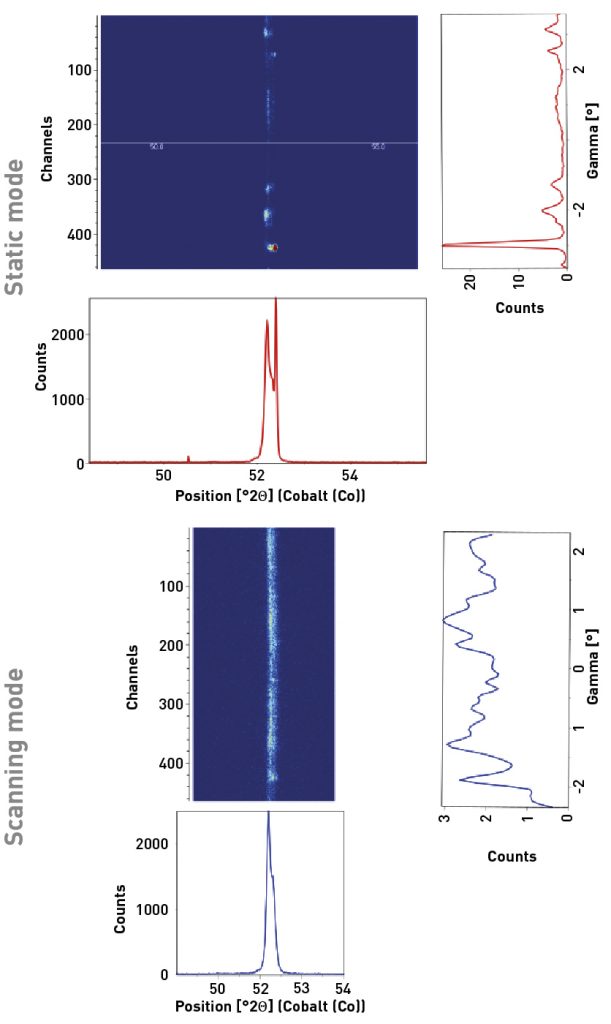
Fig. 7 compares the static and scanning 2D diffraction measurements of the (110) peak and integrated 1D scans for Fe-3 wt.% Si produced using the rotated raster direction and then annealed at 1000°C for 1 h in H2. In the static 2D measurement, the diffraction pattern is dominated by a single diffraction spot at 52.4° 2theta; whereas in the scanning 2D measurement the diffraction intensity is distributed amongst many spots more closely approaching an ideal diffraction ring. This is highlighted in the integrated intensity vs gamma plot, which shows how intensity is distributed along the arc of the Debye diffraction ring. In the static measurement, a peak at -3° gamma dominates the plot. In the scanning measurement, intensity is broadly distributed across the full observed gamma range. The scanning measurement does not match an ideal powder specimen, which would have a smooth and constant intensity at all gamma values; but the scanning measurement clearly represents data more closely approaching ideal crystallite statistics.
When a large X-ray beam and scanning mode data collection are combined, the crystallite statistics can be considerably improved. Fig. 8 compares data for all longitudinal specimens using a scanning 1D mode with a large X-ray beam using a half degree divergence slit and 20 mm mask that produces an irradiated footprint of 4.5 x 27 mm when measuring the (211) peak at 99.5° 2theta. The scanning 1D mode discards some of the microstructural information that can be derived from a 2D scan, but the scanning 1D mode allows a much larger X-ray beam to be used.
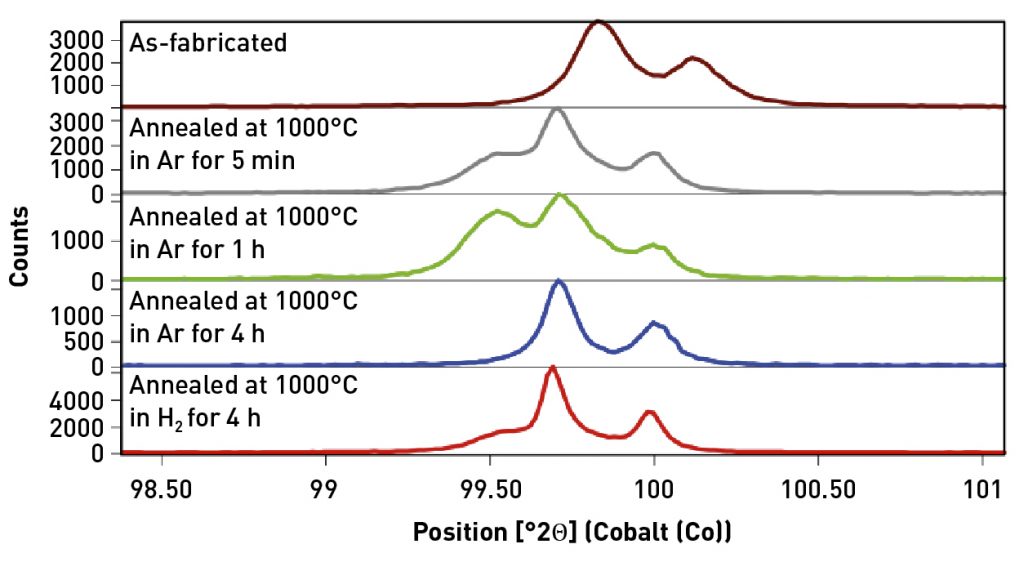
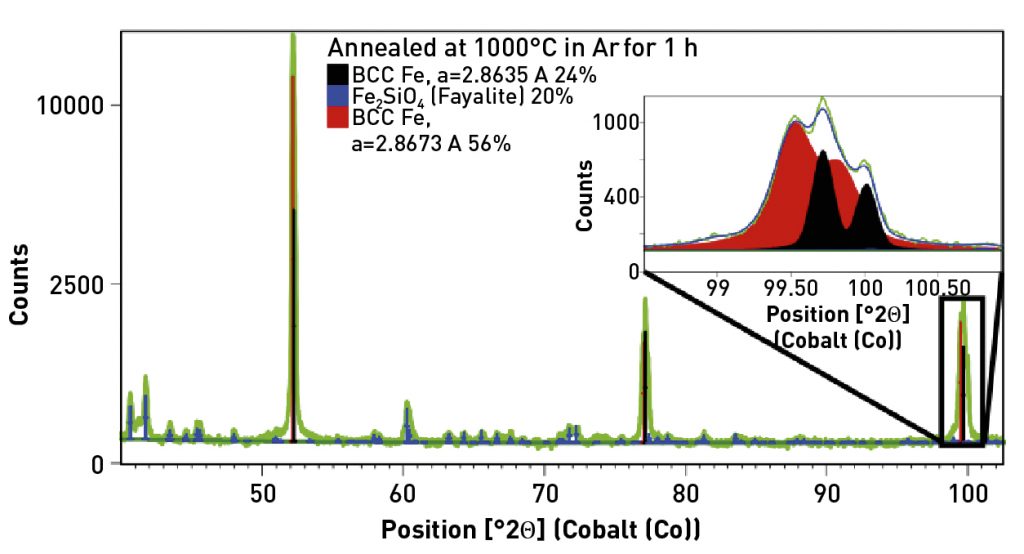
The as-fabricated specimen is purely BCC Fe, as indicated by the single (211) diffraction peak at 99.8° 2theta, while the annealed samples contain varying amounts of a secondary phase indicated by a diffraction peak at 99.5° 2theta. Phase analysis and whole pattern fitting was performed on data from the as-fabricated sample and from the specimen annealed in Ar for 1 h, which exhibited the strongest peaks of the secondary phase. This specimen was also the only one to exhibit a third phase, as shown in Fig. 9.
Whole pattern fitting of data from the as-fabricated specimen indicates a BCC Fe phase with lattice parameter a= 2.8633 A. This lattice parameter is consistent with reported values for Si-doped Fe [16], which is slightly smaller than pure Fe. The fitting also indicated a slight <001> texture.
The specimen annealed at 1000°C in Ar for 1 h contained two BCC Fe phases and ~ 20 wt.% Fe2SiO4. The two BCC Fe phases had lattice parameters of 2.8635 and 2.8673 A. The first value is again consistent with other lattice parameters reported for Si-doped Fe, while the second value is more consistent with pure Fe. This suggests that, as grains grew during annealing, some grains became Si-rich while others became Si-deficient. This result is not entirely consistent with EBSD analysis reported for these samples [14], so further analysis may be warranted. Whole pattern fitting also indicated that the texture of the two Fe species differed. The Si-rich phase had a pronounced <001> texture, while the Si-deficient phase had a <111> texture.
One final qualitative observation can be added to this discussion. The XRPD data are not as ‘spotty’ as would be expected for the grain sizes reported based on EBSD analysis of these specimens [14]. This qualitatively indicates that the crystallite statistics are not as poor as expected. This discrepancy can be understood by distinguishing between particle, grain, and crystallite size. A crystallite is a unit volume where the atomic structure is undistorted, producing continuous crystallographic planes with uniform lattice spacing. Anything that disrupts the uniform lattice spacing and orientation will form a boundary for the crystallite. This may be a grain or particle boundary, but may also be a dislocation wall, antiphase domain boundary, or similar distortion of the atomic structure. A grain is a unit volume where the crystallographic planes are generally parallel. A grain boundary is created by a change in the direction of the crystallographic planes that maintains some atomic bonding across the grain boundary. A particle is a discrete unit volume that does not share atomic bonding across the boundary with neighbouring particles. As such, a particle may contain multiple grains, and a grain may contain multiple crystallites. EBSD will most often quantify grain size and the misorientation angle between neighbouring grains. However, samples with high concentrations of dislocations, stacking faults, and other crystallographic defects may have a crystallite size that is smaller than the grain size measured by EBSD and other techniques. Given that the XRPD data show better-than-expected crystallite statistics and that EBSD indicates a high concentration of geometrically necessary dislocations (GNDs), it seems reasonable to conclude that the crystallite size of the Fe-3 wt.% Si samples was smaller than the grain size.
Summary
Parts made by Additive Manufacturing often have crystallite sizes that are challenging for precise and accurate measurement by X-ray powder diffraction (XRPD). The error produced in peak intensities may complicate phase analysis and may compromise quantitative phase analysis and texture analysis. The error produced in peak position will compromise lattice parameter and residual stress analysis. Collecting data with a scanning position sensitive detector instead of a static position sensitive detector or point detector can improve the crystallite statistics. A larger X-ray beam footprint will also improve crystallite statistics, though this may compromise spatial resolution on the specimen. Care must also be taken to preserve sufficient angular resolution of the diffraction data when using a larger X-ray beam.
Other strategies for improving X-ray powder diffraction analysis, not explored in this article, include using shorter wavelength X-rays (such as from a Mo anode X-ray tube) to increase the irradiated volume and the number of diffraction peaks observed in a measurement; and using parallel-beam or high-resolution optics to improve the accuracy of peak position measurements.
Author
Scott A Speakman, PhD
Principal Scientist
Malvern Panalytical
[email protected]
www.malvernpanalytical.com/en/products/product-range/empyrean-range
Acknowledgements
FeSi samples were fabricated as part of work sponsored by the US Department of Energy, Office of Energy Efficiency and Renewable Energy, Advanced Manufacturing Office, under contract DE-AC05-00OR22725. XRPD data were collected using facilities generously provided by Prof. Prashant Kumta at the Energy Innovation Center of the University of Pittsburgh.
References
[1] A W Hull, ‘The crystal structure of iron,’ Phys Rev 9 83-87, 1917
[2] A W Hull, ‘X-Ray Crystal Analysis of Thirteen Common Metals,’ Phys Rev 17, 571, 1 May 1921
[3] C Brown, J. Lubell, R. Lipman, NIST Technical Note 1823: Additive Manufacturing Technical Workshop Summary Report, Nov 2013.
[4] P M Mignanelli, N G Jones, E J Pickering, O.M.D.M. Messé, C M F Rae, M C Hardy, H J Stone, ‘Gamma-gamma prime-gamma double prime dual-superlattice superalloys’, Scripta Materialia, Volume 136, 2017, Pages 136-140, https://doi.org/10.1016/j.scriptamat.2017.04.029.
[5] Mostafa, A; Picazo Rubio, I; Brailovski, V; Jahazi, M; Medraj, M, Structure, Texture and Phases in 3D Printed IN718 Alloy Subjected to Homogenization and HIP Treatments. Metals 2017, 7, 196. https://doi.org/10.3390/met7060196
[6] Todaro, C J, Easton, M A, Qiu, D et al. Grain structure control during metal 3D printing by high-intensity ultrasound. Nat Commun 11, 142 (2020). https://doi.org/10.1038/s41467-019-13874-z
[7] P M de Wolff, ‘Particle statistics in X-ray diffractometry’, Appl. Sci. Res., 7, (1958) pg 102-122.
[8] Davis, Jenkins, McCarthy, Smith, Wong-Ng, ‘Chapter 4. Specimen Preparation in X-ray Diffraction,’ pgs 128-132 in A Practical Guide for the Preparation of Specimens for X-ray Flourescence and X-Ray Diffraction Analysis, eds V.E. Buhrke, R. Jenkins, D.K. Smith, Wiley-VCH, New York, 1998.
[9] B B He, Two-Dimensional X-Ray Diffraction, John Wiley & Sons, NJ, 2009, pgs 380-387.
[10] S A Speakman, ‘Additive manufacturing of Inconel 718: characterizing parts and powders’, www.malvernpanalytical.com/en/learn/knowledge-center/application-notes/an20200929aminconel718xrfxrd
[11] D I Bish and R C Reynolds, Jr, ‘Sample Preparation for X-Ray Diffraction,’ Reviews in Mineralogy volume 20: Modern Powder Diffraction, DL Bish and JE Post [eds], The Mineralogical Society of America, Washington DC, 1989, pgs 80-82.
[12] H P Klug and L E Alexander, X-Ray Diffraction Procedures for Polycrystalline and Amorphous Material, Wiley, NY (1974), pg 365-368.
[13] S A Howard and K D Preston, ‘Profile Fitting of Powder Diffraction Patterns,’ Reviews in Mineralogy volume 20: Modern Powder Diffraction, D L Bish and J E Post [eds], The Mineralogical Society of America, Washington DC, 1989, pg 217-270.
[14] M P Haines, F List III, K Carver, D N Leonard, A Plotkowski, C M Fancher, R R Dehoff, S S Babu, ‘Role of scan strategies and heat treatment on grain structure evolution in Fe-Si soft magnetic alloys made by laser-powder bed fusion,’ Additive Manufacturing 50 (2022) 102578.
[15] R Jenkins and R L Snyder, Introduction to X-ray Powder Diffractometry, Wiley & Sons, NY, 1996, pages 240-243.
[16] Shyni P C, Alagarsamy P, Physica B, 448, 60, (2014)
LAST MONTH’S MOST-READ ARTICLES