

Laser Beam Powder Bed Fusion: Process developments and numerical simulation
A technical session at the Euro PM2021 Virtual Congress, organised by the European Powder Metallurgy Association (EPMA) and held October 18–22, 2021, was devoted to the consideration of process developments and numerical simulation approaches for Powder Bed Fusion (PBF) Additive Manufacturing technologies. In this report, Dr David Whittaker reviews four of the papers presented on this topic, looking at process parameter optimisation, increasing quality for Ti6Al4V medical parts, techniques to improve the AM of hot-work tool steels, and powder spreading improvements for stainless steel. [First published in Metal AM Vol. 7 No. 4, Winter 2021 | 35 minute read | View on Issuu | Download PDF]
Efficient process parameter optimisation procedure in Laser Beam Powder Bed Fusion
The first of the papers in this session came from Maria Montero-Sistiaga, Marc De Smit, Ralph Haagsma and Ian Bennett (NLR, the Netherlands), and showcased this group’s development of an efficient process parameter optimisation procedure for Laser Beam Powder Bed Fusion (PBF-LB) [1].
Important PBF-LB material properties, such as porosity, microstructure and surface roughness, are largely determined by the applied layer thickness, laser power, scan velocity and distance between laser scan vectors. Past studies aimed at Laser Beam Powder Bed Fusion parameter optimisation have generally been based on the definition of a test matrix that covers an array of samples with different combinations of parameters. These methods require the production and analysis of a large number of samples, making them time consuming and expensive.

This presented paper described work done on the development of a new methodology for selecting Laser Beam Powder Bed Fusion parameters. The approach was based on the analysis of a large number of parameter combinations with a minimum number of samples. Parameters were optimised for processing AlSi10Mg alloy, which was selected because of its suitability for use in thermal control applications. In this work, the methodology for optimising the contour, hatch (also known as core or bulk) and interface parameters was investigated.
For optimisation of the contour, thin walls were built with varying laser power and scan speed. For the hatch area, blocks were built with varying hatch distance along the sample length. Finally, for selection of the optimum interface settings, the hatch area was rotated relative to the sample contour in order to induce a variable offset between the contours and the hatch. Parameter selection was carried out based on analysis of sample cross-sections. The selection methodology was described for each optimised setting.

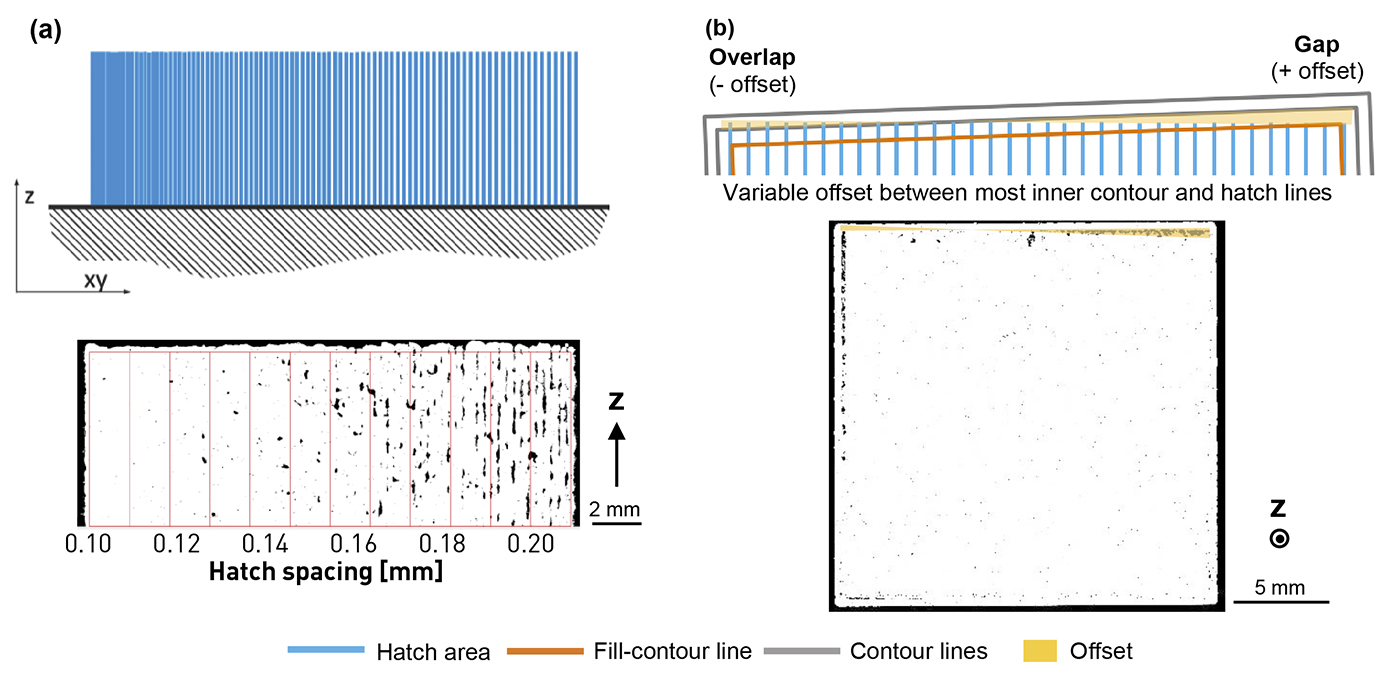
The AlSi10Mg powder used in the study had the composition shown in Table 1. The powder particles were not fully spherical and had sizes between 20–63 μm, with an average size of 43.8 μm. The samples were processed on an SLM 280HL machine. Three types of geometry were generated: thin walls, blocks with varying hatch distance and blocks with rotated hatch, as shown in Fig. 1.

Thin wall samples were built by stacking single vector scans in multiple layers. Each wall was built with a specific laser power and scan speed combination. The laser power (P) was varied from 70 to 300 W and the scan speed (v) from 300 to 667 mm/s, building a total of 120 single track walls. Variable hatch block samples (10 x 20 x 7 mm) were made, in which the applied hatch line distance (track distance/space) was increased in small steps from 0.1 to 0.21 mm. Each block was built with a specific laser power and scan speed combination. Twenty-four blocks were built with a P of 350 W or 380 W and v between 875 and 1900 mm/s.
An example of the variable hatch spacing within the block is shown in Fig. 1(a). On the left side, a hatch distance of 0.1 mm was applied, then increased up to 0.21 mm on the right side. Lastly, two blocks (20 x 20 x 7 mm) with a rotation of the hatch area were built. This rotation was made in order to create a variable offset between -0.1 and 0.2 mm between the contour and the hatch area (core), as shown in Fig. 1(b). For simplicity, the linear energy density (EL) term was sometimes used for determining a P and v combination. This was calculated as: EL=P·v [J/ mm].

The quality of the samples was evaluated by analysing optical microscopy images of the cross-sections using a MATLAB script. For the thin walls, the porosity, thickness and roughness were evaluated. The blocks with variable hatch and rotated hatch were analysed based only on the porosity. For this purpose, the region to be analysed was subdivided into twelve equally-shaped rectangular fields (Fig. 1(a)). With this procedure, the porosity could be analysed along the cross-section as a function of the varied parameters.
For optimisation of the contour parameters, cross-sections of the walls were analysed based on the thickness, roughness and porosity. It was observed that a low roughness was obtained at high v and Ev, and low porosity for low Ev. Therefore, medium Ev and high v should be selected for a compromise between low porosity and low roughness; 667 mm/s, 190 W and 0.28 J/mm. After selection, the thickness was considered for setting the beam compensation and the distance between neighbouring contours. The former was taken as half of the track width and, for the latter, 30% overlap was recommended. In this case, the wall thickness was 0.296 mm, hence the beam compensation was 0.15 mm and the distance between contours 0.21 mm.
After selecting contour parameters based on the thin walls, the parameters for the hatch or core were selected. Blocks with varying hatch distance were built, building each block with a specific laser power and scan speed combination. In the case of aluminium, it was observed, in previous studies by this group, that high laser power is required for building parts with low porosity. Therefore, only two laser powers were selected in this work; 350 and 380 W. Table 2 gives an overview of the analysis of the variable hatch blocks. From each block, the porosity in the 12 fields was determined. The minimum value of the porosities is shown in column 5. The field number in which this minimum porosity was measured is shown in column 6. In addition, the average porosity over a larger area of four fields was evaluated in column 7 in order to rule out the effect of clustered pores. This value represents how stable the parameters were over a larger area. Lastly, the average of the values in column 7 was calculated for each laser power, shown in column 8.
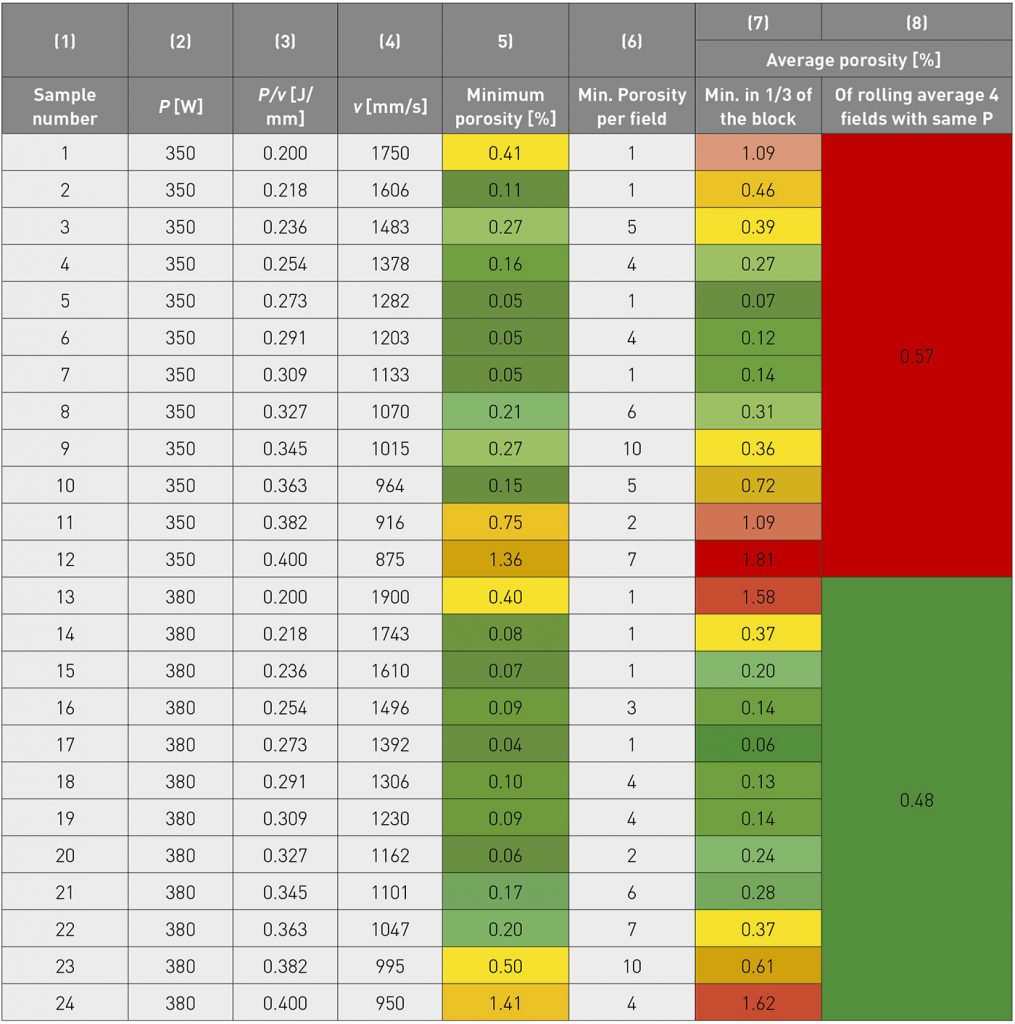
From Table 2, it can be observed that using a laser power of 380 W resulted in lower porosity. In addition, by looking at the rolling average (column 7), a low porosity was found in a wider scan speed range. After selecting the laser power, the scan speed was selected. For this, columns 5 and 7 were considered. It can be concluded that the sample built with 1392 mm/s showed the lowest porosity values. After selecting the P and v combination, the chosen block was analysed by looking at the porosity level for the hatch spacing. It could be observed that, below 0.14 mm hatch spacing, low porosity values were obtained, below 0.09%. A hatch distance of 0.11 mm resulted in 0.04% porosity.
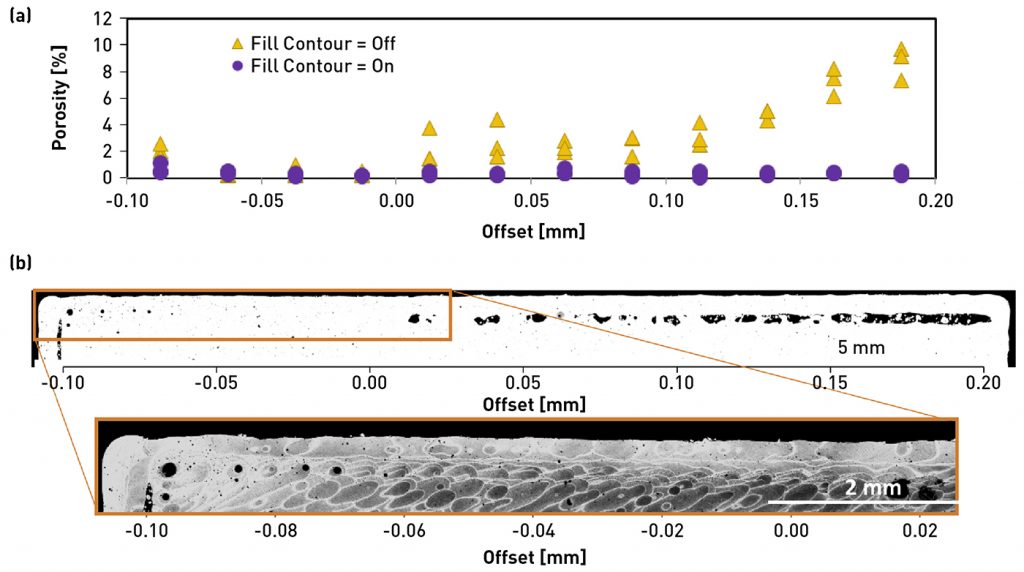
After selecting the contour and the hatch parameters, the interface between the two needed to be optimised. Porosity in this region must be minimised when the parts are subjected to fatigue loading, since it is known that surface and sub-surface defects are detrimental. Therefore, in this work, the hatch area was rotated in order to create a variable offset between the hatch and the contour, as shown in Fig. 1(b). In addition, the effect of using a fill-contour, an extra contour scanned between the contour and the hatch, was evaluated.

The measured porosity in the hatch-contour region as a function of the hatch-contour offset is shown in Fig. 2. In Fig. 2(a), it is shown that the fill-contour strongly reduced the porosity between the hatch and contours. When scanning without fill-contour, the porosity increased when increasing the offset to higher positive values. This is shown in Fig. 2(b) where more irregular-shaped pores are present on the right-hand side of the cross-section. It can be observed that, above 0.00 mm, large lack-of-fusion pores were present. In order to select the appropriate offset value, a negative offset should be applied. In this case, an offset of -0.03 mm was selected. Also, it was recommended to use a fill-contour to ensure good overlap. It should be noted that these blocks were built without skywriting methods, which are known to decrease the key-hole pores at the start of the tracks. Therefore, the authors recommended that the methodology should be repeated on blocks built using ‘skywriting’ mode. Skywriting in Additive Manufacturing refers to the situation where the mirror used for scanning has already been accelerated to the desired speed prior to exposure.
The authors made the overall claim that this proposed methodology allows an efficient optimisation method for contour, hatch and interface parameters. The contours can be optimised by building thin walls with varying laser power and scan speed. For parameter selection, the porosity, as well as the roughness and thickness, are considered. The hatch parameters were selected based on blocks built with variable hatch spacing. This method drastically reduces the number of samples that need to be built for the selection. Lastly, a rotated hatch start allows the optimisation of the offset between the contour and the hatch in just one block. This method also allows the evaluation of the use of fill-contours and different laser dynamic modes.
Towards increased quality of Ti6Al4V medical parts by using argon-helium to reduce spatter formation
The session’s second paper, from Sophie Dubiez-Le Goff and Pierre Foret (Linde GmbH, Germany) and Marie Fischer, Gael Volpi, and Donatien Campion (3DMedLab, France), reported on a study aimed at enhancing the quality of Ti6Al4V medical parts by using argon-helium to reduce spatter formation [2].
In Laser Beam Powder Bed Fusion, the gas atmosphere can be used as a parameter in the process by modifying the O2 content or by changing the gas type: argon, nitrogen, helium and argon-helium mixtures all being possibilities depending on the material. It is regularly seen that using an argon-helium mixture is beneficial. Indeed, it has been shown that with Ar-He instead of standard Ar, there is less spatter accumulation and an increased density is obtained in Ti6Al4V specimens, while using higher build rates.
In the reported study, the authors have taken an interest in the impact of the shielding gas on the manufacturing of Ti6Al4V lattice structures, as PBF-LB of fine geometries, such as lattice structures, usually generates more spatter. The aim was to highlight spatter formation using three different gases (helium, argon, and an argon-helium mixture) and to quantify the effect of using each gas on material characteristics and mechanical properties.
An EOS M290 machine, featuring an Yb laser of nominal power 400 W, was employed to build Ti6Al4V lattice structures. Gas atomised Ti6Al4V powder, supplied by EOS, was processed. Its particle size distribution was between 15 and 45 μm. Process atmospheres considered were high purity argon gas, high-purity helium gas and an argon-helium mixture from Linde, named ADDvance® Laser230. Table 3 gives the gas properties.
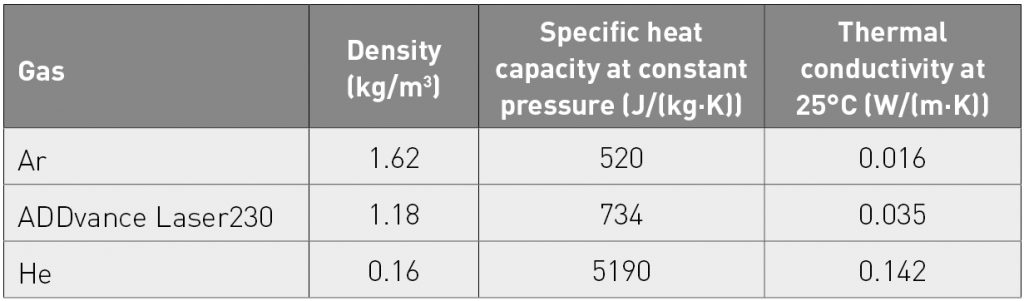
Parts were built using the recommended parameter set from EOS with a volumetric energy density of 55.6 J/ mm3 and a ‘fast’ parameter set with a decreased volumetric energy density of 38.5 J/mm3.
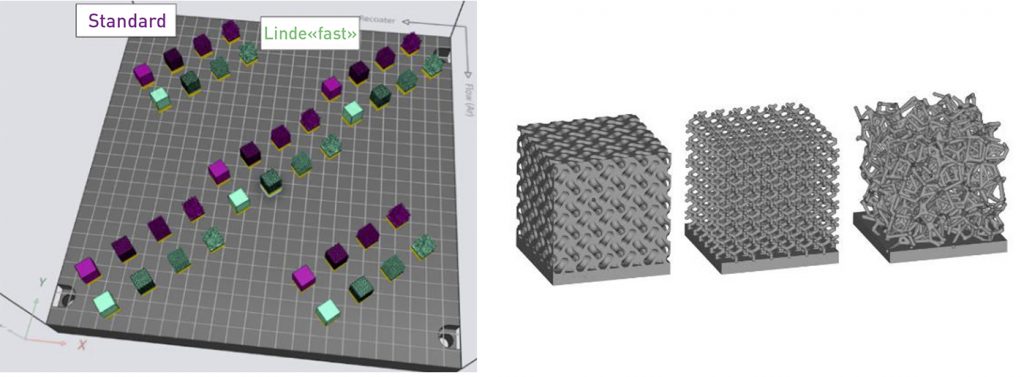
Fig. 3 presents the nesting of the parts on a build plate: one line corresponds to three common lattice structures (gyroid, dodecahedron and trabecular) and a cube. One line was built with the recommended parameters and a second line was built behind it with respect to the gas flow from the back of the chamber to the front, with the ‘fast’ parameters. This pattern was duplicated and positioned in five zones of the build plate, in order to analyse a potential effect of the position on by-products’ behaviour. No obvious dependence of spatter density and intensity on the position on the build plate was observed, suggesting that the gas flow was homogeneous over the entire process plate.
An optical tomography (OT) monitoring system, provided by EOS, was associated with the machine. This acquired the process radiation (i.e. emitted photons) from the building platform, supplying one greyscale image per layer. The data acquired outside the parts were analysed to characterise the by-products.
Images extracted from the OT were post-processed with image analysis software. Two approaches were used. The first approach focused on the density of spatter around the parts. The result was an image, in which the grey value of each pixel was representative of the amount of spatter hitting that pixel over all the layers. The second approach focused on the intensity of spatter according to three intensity ranges. The result was an image, in which the colour of each pixel was representative of the intensity (not the quantity) of the spatter hitting that pixel over all the layers.
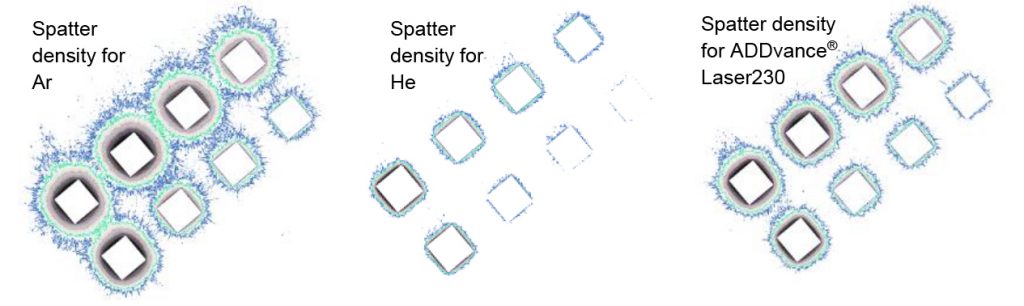
Fig. 4 shows the resulting image for each job (see first approach, above). The coloured lines highlight four iso-density lines: purple = high density, red = medium-high density, green = medium-low density and blue = low density. Significant differences can be seen between the same jobs built with the different gases. For the argon gas, a relatively high amount of spatter is spread well around the part, including the high density level. For the helium gas, spatter is spread less far around the parts and, for some structures, at only medium to low density levels. The ADDvance® Laser230 job seems to show an intermediate situation between the two others.
Overall, the denser parts, such as the cube, produce a larger amount of spatter, compared with the lattice parts. Indeed, as the vector trajectory length increases, the spatter ejection increases proportionally, resulting in a larger amount of spatter. This is consistent with a lesser amount of spatter observed in the trabecular structure, the most “porous” one. Also, it can be noted that the ‘fast’ parameter set produces a lesser amount of spatter. Hence, using lower volumetric energy density is an efficient way to reduce the amount of generated spatter.
Fig. 5 highlights all spatter emitted from the samples built at three intensities (second approach, above). This allows the extraction of the distance, at which spatter of high, low or medium intensity is projected from the part being built.
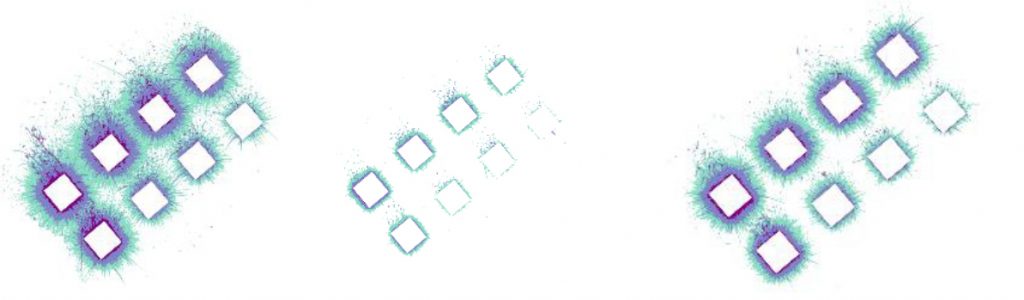
It is clear that the argon job generates the most low and medium intensity spatter. These are spread over a wider diameter around each part, while they are scarcer in the case of helium. The ADDvance® Laser230 job again shows an intermediate behaviour.
Material integrity, i.e. porosity, was analysed by means of X-ray micro-tomography. Digital radioscopies were taken while the sample rotated, resulting in 900 projections, allowing for 3D volume reconstruction. Segmentation operations were applied to the reconstructed 3D volumes, keeping the same threshold for identical structures, hence highlighting the lattice volume and the pores volume. Porosity content could thus be calculated for each sample. All lattice samples from the centre of each build plate were analysed.
Overall, the porosity content was below 0.13% for all the structures. Different porosity contents were obtained while using the respective building strategies. Overall, higher density was achieved with the ‘fast’ exposure parameters and this was even heightened while building under the ADDvance® Laser230 gas mixture. This strategy generates less energy and heat in the melt pool and is thus more adapted to the small melted areas in lattice structures. Also, the low porosity content obtained with the ADDvance Laser230 gas mixture can be explained by the lesser amount of spatter observed, leading to an improved stability of the process.
Mechanical characterisation of the built samples comprised compression testing with a 50 kN testing machine. The protocol was as follows: pre-load at 0.1% Fmax, loading to 70% εe, unloading to 20% εe, loading to 50% strain; on lubricated compression plates, at room temperature. The stress-strain curves were post-processed according to the ISO 13314 standard. The elastic gradient was measured on the unloading portion of the curve and the first maximum compressive stress was extracted.
Each type of lattice followed its own failure behaviour under compression. A succession of stress peaks and breaks along with overall densification were observed for the dodecahedron structure. For the trabecular structure, small instabilities were visible in the stress-strain curve, corresponding to successive breaks of the struts. There was little densification. The gyroid structure showed one maximum stress, followed by a drop and densification of the specimen. Overall, the structures all remained in one piece.
For the first compressive stress and the elastic gradient, extracted from each curve, the average value and standard deviation were calculated, with the resulting data being presented in Fig. 6.
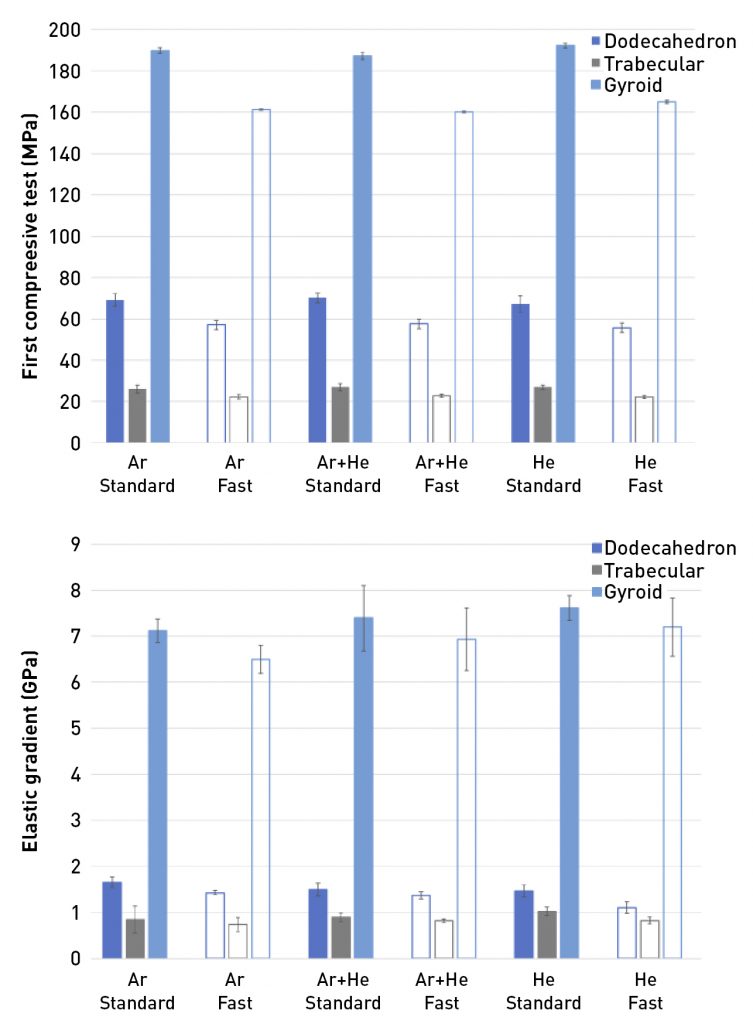
The structures built with the fast exposure strategies showed slightly lower mechanical properties. The hypothesis proposed by the authors was that the struts might be slightly smaller due to the lower energy input, leading to more flexible structures. This could be resolved by adjusting the beam offset parameter in order to reach larger thicknesses. The use of the different gases does not seem to have affected the mechanical properties, suggesting that the porosity variations presented earlier do not have a significant impact. The lattice’s geometric structure is the major factor.
Overall, the authors concluded that this study had demonstrated that helium or argon-helium mixture can significantly reduce the spatter in terms of quantity and spatial spread. For series production builds, this could allow the building of the parts closer to each other in a stable manner and without them interfering with each other and thus increase productivity.
Another beneficial effect of the argon-helium gas mixture was observed, with reference to the resulting higher density obtained for the lattice structures. The mechanical properties are not significantly impacted by the process gas type, but the more stable process observed with He or the argon-helium mixture might be beneficial in maintaining good material characteristics, when building larger parts.
Laser Beam Powder Bed Fusion of hot-work tool steel 1.3397 processed at elevated preheating temperatures
Next, Taoran Ma and Anton Dahl-Jendelin (RISE IVF AB, Sweden), Gustav Palmgren and Karin Jakibsson (Erasteel Kloster AB, Sweden) and Peter Vikner Aubert & Duval, France) reported on an investigation of the potential benefits of elevated preheating temperatures in the Laser Beam Powder Bed Fusion processing of hot-work tool steel 1.3397 [3].
The Additive Manufacturing of carbon-containing tool steels can be challenging, because such tool steels are highly prone to cracking and distortion during the AM process or during subsequent cooling when austenite transforms to martensite, accompanied by a sudden volume increase, inducing considerable residual stress, which in turn triggers cracking.
1.3397 tool steel is a hot-work steel and contains ~0.6 wt.% carbon. An early study on Laser Beam Powder Bed Fusion-processed 1.3397 showed that there were cracks in the as-built specimens. In this reported study, the authors applied baseplate heating to elevated temperatures and varied scanning speed in order to control residual stress. A series of analyses was performed to study the influences of bottom heating temperature and laser scanning speed on the alloy.
Hot-work tool steel 1.3397 was manufactured with the Laser Beam Powder Bed Fusion process using a SLM 280 metal AM machine. The powder used in this work had a particle size distribution over the range 15–63 μm. Its composition is given in Table 4. During the Laser Beam Powder Bed Fusion process, the baseplate was preheated and kept at a temperature of 400°C or 500°C and the laser speed was varied between 750 mm/s and 950 mm/s. Other process parameters were set to be unvaried, with a recoating powder layer thickness of 60 μm, hatch distance of 120 μm, and laser power of 275 W. The specimen in the build chamber was protected by a continuous argon flow. Cubic specimens with dimensions of 20 mm x 20 mm x 20 mm and bar specimens with sizes of 12 mm x 12 mm x 60 mm were manufactured. Two bar specimens were saved in the as-built condition for microstructure analysis and the rest were austenitised at 1025°C for 25 min in a vacuum furnace, followed by high-pressure nitrogen gas quenching. The quenched specimens were then tempered 3 times at 560°C for 1 h in a furnace with air atmosphere. After the heat treatment, the top and bottom sections of the specimens were cut out for chemical analysis. All outer surfaces were ground before the analysis to remove the oxides. The analysis was performed by combustion combined with infrared spectroscopy (LECO).

The as-built 1.3397 steel specimens with baseplate heated to 400°C and 500°C were found to contain a dendritic/cellular structure, see Fig. 7, a typical structure for Laser Beam Powder Bed Fusion-processed carbon tool steel. The microstructure was only mildly affected by etching, which indicates that it was a mixture of untempered martensite and retained austenite. The material built with the baseplate preheated to 200°C (in earlier published work) was etched much more than that preheated to 400°C. This suggests that the specimen built with baseplate preheated to 200°C contained tempered martensite, which etches more readily than untempered martensite.
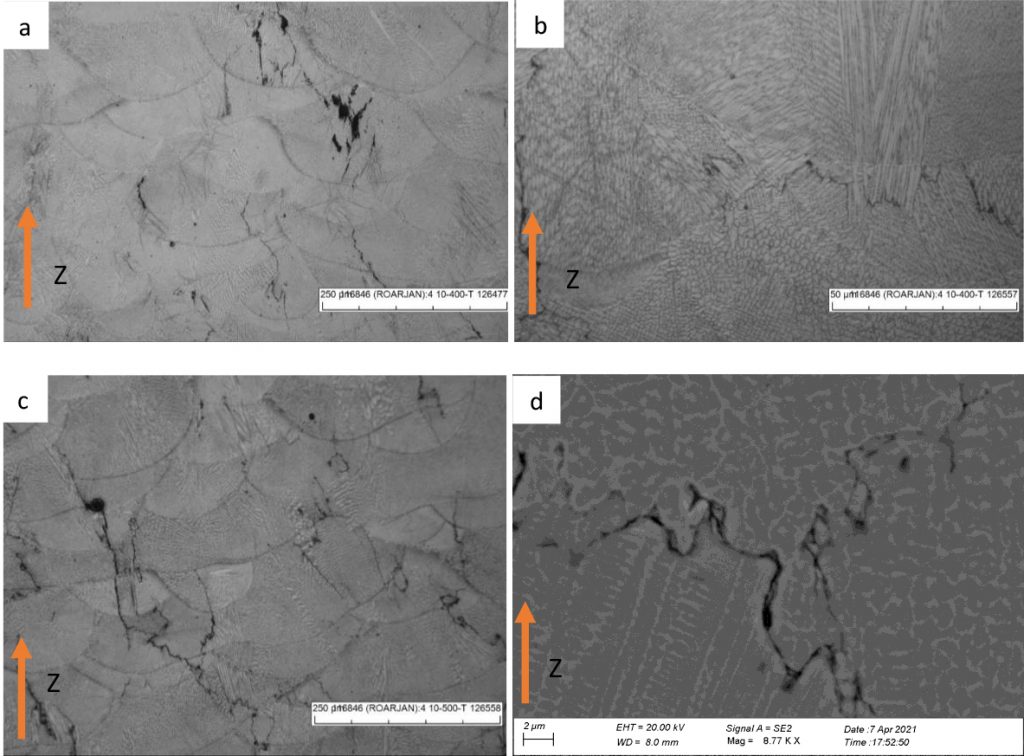
The martensite start (Ms) temperature is around 280°C for this alloy. During the Laser Beam Powder Bed Fusion process, the alloy was kept above the Ms temperature and martensite transformation occurred only after the building finished, the baseplate heating was turned off and the specimen together with the build plate cooled down to room temperature. This is a clear difference from the microstructure of the 1.3397 steel built with baseplate heating to 200°C, which is below Ms, where martensite formed shortly after solidification and then part of the martensite was tempered by the heat from neighbouring layers and those above. Hence, tempered martensite was obvious in the microstructure. Vickers hardness values of the as-built specimens manufactured with baseplate heated to 200°C, 400°C and 500°C were ~683 ± 7, ~705 ± 27 and ~711 ± 40 HV10, respectively.
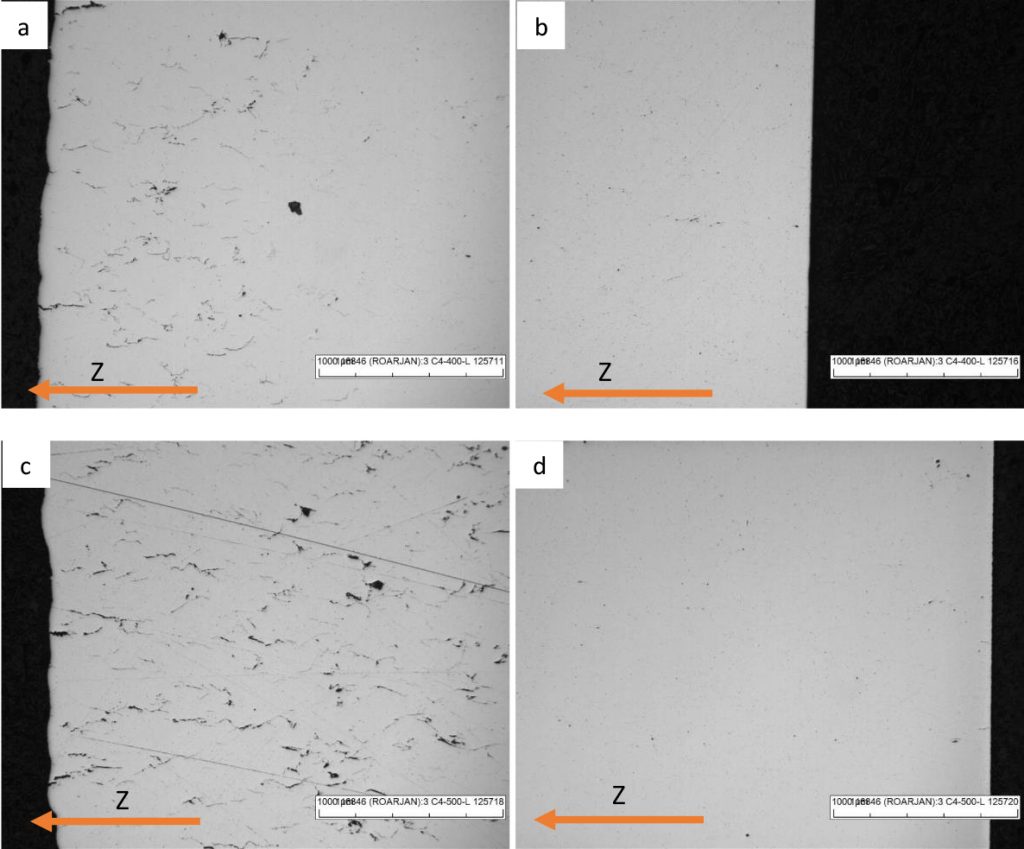
Below the top surface, a region with cracks longer than 100 μm was found, see Fig. 8. For the baseplate heated to 400°C, within the area 1.5 mm below the top surface, this region was rich in large cracks longer than 100 μm. For the 500°C case, the region with large cracks was deeper than 2.5 mm below the top surface. The cracks were oriented in the Z direction, i.e. the temperature gradient direction. Cracks were found at the interface where the orientation of cells changes, see Figs. 7(b) and (d). In the bulk, small voids and microcracks could be seen, but no large cracks (Fig. 8). Cracks do not occur evenly in the bulk, but mainly in the top region. The macrocracks are probably due to the shrinkage during cooling after the process.
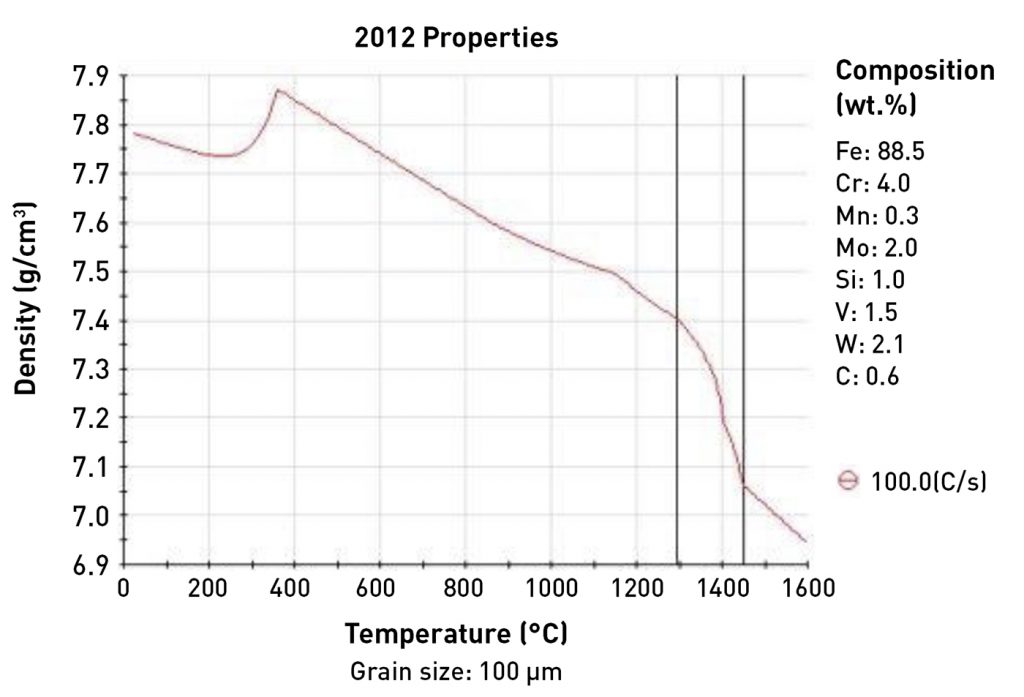
The density of the alloy as a function of temperature was calculated using JMatPro software, shown in Fig. 9. The alloy shrinks from a high temperature down to around 350°C and then a sudden expansion occurs when the matrix transforms to martensite. In relation to the current process, when the building was finished, the specimens and build plate started cooling from around 500°C. There was firstly a thermal shrinkage stage from 500°C down to around 350°C, then followed by an expansion due to martensitic transformation at around 250°C. The material further shrank with deceasing temperature to room temperature. It is highly probable that cracking happened due to quick and uneven shrinkage from 500°C down to around 350°C, considering that the top layers cooled down faster than the layers below, which were well surrounded by the warm powder bed. For the preheating to 400°C case, the extent of shrinkage was relatively less and hence less severe cracking occurred than for preheating to 500°C. As mentioned previously, the cracks were found at the grain boundaries where the dendrite orientation changed (Figs. 7b and d), which resulted in a weak region prone to cracking upon cooling accompanied by shrinkage.
Regarding the causes for the cracking of the material built with baseplate preheated to 200°C, the local residual stress is high and the untempered martensite is brittle. There is repeated local expansion and shrinkage, resulting in cracks initiated from weak points.
Based on this discussion, the authors have suggested that two approaches could be pursued, either to lower the baseplate temperature to 300°C to reduce the cooling shrinkage, meanwhile adding isolation powder layers at the top to slow down the cooling at the top for a more even volume change through the entire part, or to apply preheating to 200°C, but increase scanning speed to reduce the residual stress.
During the tempering treatment in air, the samples with cracks open to the surface picked up oxygen. Hence, the oxygen content measured in this work reflected the number of open cracks. The top region and specimens built with higher energy input were found to contain a larger number of open cracks, whereas the bottom region had fewer cracks. High energy input and higher preheating temperature were found to result in the most cracks, which is consistent with the microstructural analysis.
Analytical and numerical modelling of stainless steel powders spreading in AM powder bed fusion processes
Finally, M Soulier, A Burr, N Dubois, G Roux, J Maisonneuve and R Laucournet (CEA-LITEN, France) turned their attention to the analytical and numerical modelling of stainless steel powder spreading in AM powder bed processes [4].
The qualification of raw material spreadability is usually carried out by ex-situ characterisation by means of phenomenological tests including funnel tests, avalanche angle, angle of repose, shear test, and Hausner ratio. However, the suitability of these techniques to fully describe the dynamics of powder spreading under real conditions in an AM machine is often questioned. Numerically, most studies on powder spreading use the discrete element method, with a particular focus on the effects of recoater geometries and velocities, the layer thickness or the powder characteristics on powder bed density and surface roughness.
The aim of the presented study was to develop experimental and numerical tools to more accurately predict powder bed behaviour as a function of spreading parameters and powder characteristics. Three commercial 316L powders were selected as study cases, exhibiting complementary particle size distributions and particle morphologies to obtain a representative set of powders used in Powder Metallurgy. The EOS and Sandvik powders were gas atomised and showed a spherical shape. An EOS powder coarser than the Sandvik powder was selected, in order to study the effect of particle size. The Höganäs powder was water atomised. This last powder, usually dedicated to conventional PM, had a similar particle size to the EOS powder, but had high particle acicularity.
Table 5 shows the main characteristics of the three powders chosen. Their particle size distribution was measured by laser granulometry in ethanol. The particle morphology was analysed by automated image analysis on 50,000 particles. The corresponding shape indicator studied was the mean aspect ratio, defined as the width to length particle ratio. Also, the powder flowability was evaluated by the Carney funnel test and avalanche angle tests, consisting of introducing the powder in a rotating drum and recording the angle as soon as the powder initiated an avalanche. The lower the avalanche angle, the higher was the free-flowability of the powder.
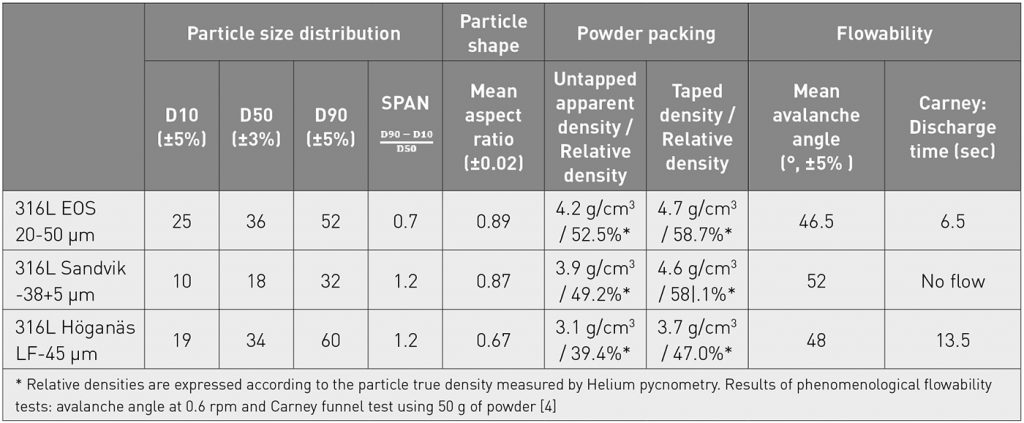
The EOS and Sandvik gas atomised powders exhibited high sphericity, with aspect ratios of 0.89 and 0.87, respectively, while the Höganäs powder was defined by a significantly higher acicularity with a mean aspect ratio of 0.67.
Because of the acicular shape, the water atomised powder showed the lowest apparent density, compared with the more spherical powders. However, the Sandvik powder was the least flowable powder with the highest mean avalanche angle (52°) and no flow in the Carney funnel. Therefore, it was concluded that powder flowability is more impacted by a fine particle size than an acicular particle shape. The characterisation of the powder bed for each 316L powder was conducted on the spreading test bench set up shown in Fig. 10. Completely automated, the bench comprised two pistons enabling powder feeding and powder discharging, with plates of 125 x 125 mm2 and a rubber blade (10 mm width with a rectangular profile) on an accurate linear axis.
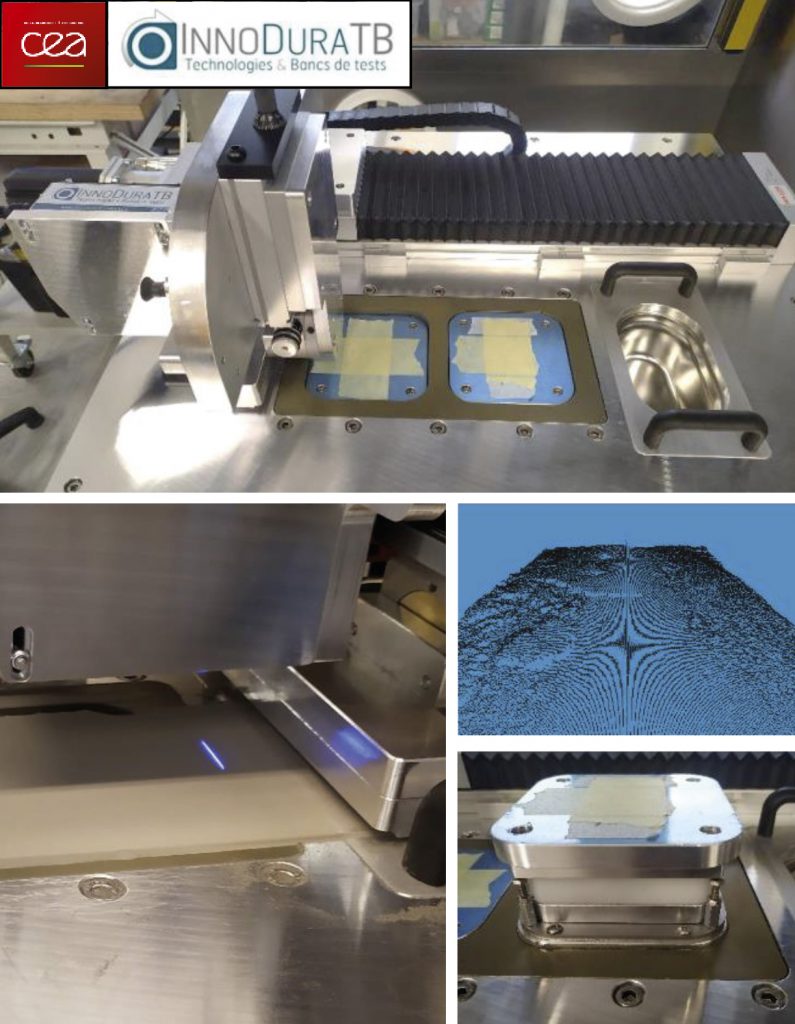
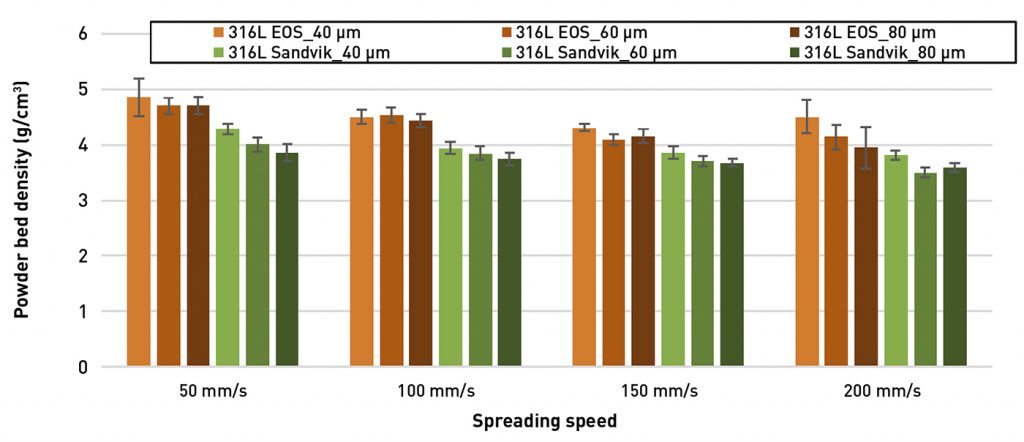
In order to characterise the powder bed surface, the spreading axis was equipped with a laser profilometrer (3200 points/16 mm line) scanning the surface to reconstitute in 3D the powder bed surface with an x/y resolution of 5 μm and a z resolution of 0.5 μm. In addition, a mass sensor was installed under the spreading plate to calculate the powder bed density in situ, with a weighing accuracy of ±10 mg. Fig. 11 shows the powder bed roughness measured for each powder as a function of the spreading speed and layer thickness. The arithmetic average of roughness (Ra) was calculated for a scanned powder bed surface of 100 x 16 mm2. Powder bed roughness appears to be closely linked to the particle shape, as demonstrated by the comparison between the EOS and Höganäs powders. The negative impact of particle acicularity on the roughness is attenuated by increasing the spreading speed. With a similar spherical shape, the Sandvik powder, two times finer than the EOS powder, leads to a bed roughness two times lower. This trend is confirmed by the roughness measurements performed on laser built parts using these three powders.
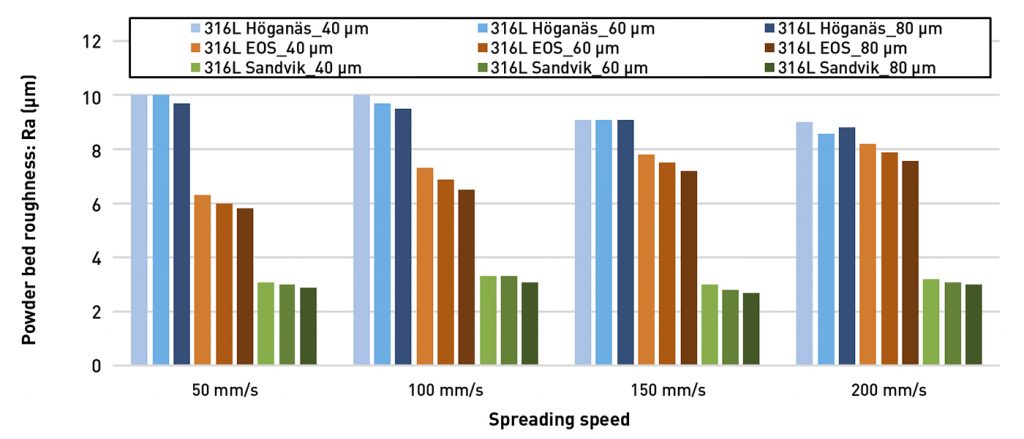
Fig. 12 shows the powder bed densities for the Sandvik and EOS powders, resulting from an average of 30 powder layers carried out for each one. The bed density appears to be close to the untapped powder apparent density (Table 5). The more cohesive Sandvik powder leads to a less dense powder bed compared to the EOS powder. However, this slightly lower powder bed density has no consequence on the final part density after laser melting, being fully dense with either powder. The powder bed density for the Höganäs powder could not be measured, but it was observed that this powder did not give a fully dense material after Laser Beam Powder Bed Fusion, despite scanning strategy optimisation.
Next, the three powders presented were modelled numerically by the discrete element method. The code used in this work was Altair EDEM and the contact law was Hertz-Mindlin with JKR. First, particles were generated using a log-normal distribution fitted to the ones experimentally determined. A layer with a thickness of 150 μm was spread at 50 mm/s, using a periodic condition in the γ-direction. Spherical particles were used for the powders from EOS and Sandvik, but a rod of three aligned spherical particles was used for the Höganäs powder, to illustrate an aspect ratio of 0.67. In this work, only the effects of particle size distribution and adhesion energy (studied for 0, 1 and 3 mJ/m2) on the bulk density and surface roughness were studied.
The thickness of powder bed was initially determined by voxelisation of spheres at a 1 μm voxel size, and then by intersecting a squared-ray of 5 μm side-length with the powder bed surface, so as to be in agreement with the accuracy of the laser profilometer. If the ray did not intersect a particle, the height was taken as 0 (minimum of the platform height). Thickness profiles along the X and Y axes were averaged and their variabilities calculated. The roughness Ra was the mean of these values in 1×1 mm2 tiles on the whole length of the powder bed.
In Fig 13b, the error bars represent the minimum and maximum roughness values to show the variability obtained along the spreading axis (X). The powder bed density was calculated from the ratio between the total mass of particles on the building platform and the nominal volume. A decrease of the powder bed density and an increase of the surface roughness were observed in Fig. 13 when the adhesion energy increased.
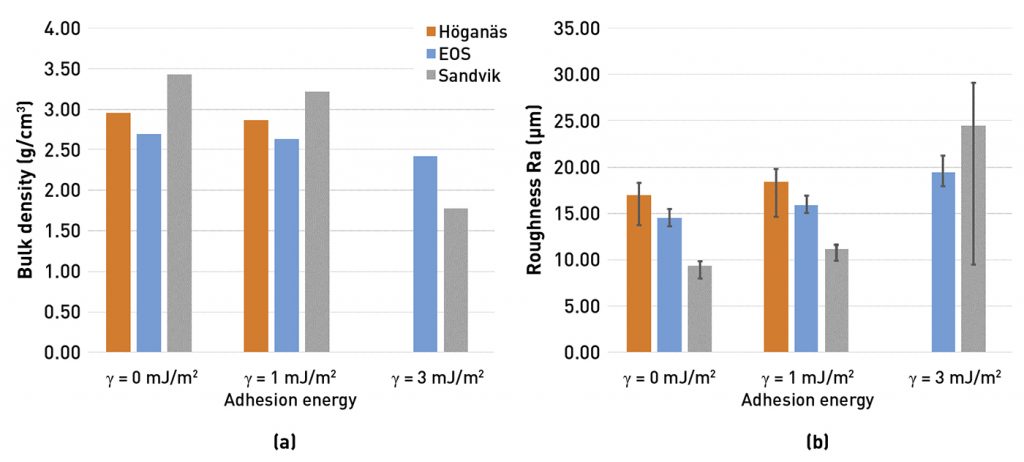
However, the average roughness value hides the local heterogeneities in the surface powder bed. Therefore, the thickness of the powder bed t was normalised to the nominal thickness t0 (150 µm), giving the parameter t/t0. This helps in understanding the large variability between the desired thickness and the simulated results. If t0 is large compared with the maximum particle size, rearrangement of particles is enhanced. Therefore, t/t0 is larger for the Sandvik powder (when γ = 0) than for the Höganäs and EOS powders. Using a slow blade speed (50 mm/s) with a high layer thickness (150 µm) results in a relatively homogeneous powder bed qualitatively for the EOS and Sandvik powders (t/t0 is uniform in the first 10 mm). However, it always ends up with a mound of powder, certainly because of the rigid wall at the end of the powder bed. Also, when the adhesion energy is too large, small aggregates appear, explaining the large error bar for the Sandvik powder in Fig 13b. Consequently, the quality of the bed is poor.
The comparison between the experiments and numerical results showed that the ranking of powders is in agreement for the roughness when γ < 3 mJ/m2 and for the powder bed density when γ > 1 mJ/m2. Hence, the numerical model is consistent with the experimental results for particle-to-particle adhesion energies between 1 and 3 mJ/m2. However, numerical results for the powder bed densities give values roughly 30% smaller than those experimentally determined and the simulated roughness values Ra are two to three times larger than the experimental ones. Future work will therefore focus on several optimisations aimed at being more confident of simulation results in comparison with experimental ones.
The sole layer deposited during simulation is not representative of a standard spreading process, as the first layer is a particular case, subjected to strong effects of boundary conditions (direct contact with the building platform). Regarding the surface profile of the bed, the average value is disturbed by local 0 values (height of the bed). It is planned to model a powder bed consisting of several layers of powder as performed experimentally.
The numerical parameters are adapted from the literature for stainless steel 316L, but really need full calibration. In particular, the coefficient of restitution between particles and the blade (in rubber) should be adapted and may challenge the effect of adhesion energy (which should also be experimentally determined).
The particle size distribution used in the numerical part of this work consisted of a given number of discrete particle sizes. This loss of continuity can influence the packing as small particles are missed.
Author and contacts
Dr David Whittaker
Tel: +44 1902 338498
[email protected]
[1] Maria L Montero-Sistiaga, NLR, Marknesse, the Netherlands
[email protected]
[2] Sophie Dubiez-Le Goff, Linde GmbH, Germany
[email protected]
[3] Taoran Ma, RISE IVF AB, Mölndal, Sweden
[email protected]
[4] Mathieu Soulier, CEA-LITEN, Grenoble, France
[email protected]
References
[1] Efficient Process Parameter Optimisation Procedure in Laser Beam Powder Bed Fusion, M L Montero-Sistiaga et al. As presented at the Euro PM2021 Virtual Congress, October 18–22 2021, and published in the proceedings by the European Powder Metallurgy Association (EPMA)
[2] Towards Increased Quality of Ti6Al4V Medical Parts by Using Argon-Helium to Reduce Spatter Formation, Sophie Dubiez-Le Goff et al. As presented at the Euro PM2021 Virtual Congress, October 18–22 2021, and published in the proceedings by the European Powder Metallurgy Association (EPMA)
[3] Laser powder bed fusion of hot-work tool steel 1.3397 processed at elevated preheating temperatures, Taoran Ma et al. As presented at the Euro PM2021 Virtual Congress, October 18–22 2021, and published in the proceedings by the European Powder Metallurgy Association (EPMA)
[4] Analytical and Numerical Modelling of Stainless Steel Powders Spreading in Powder-Bed Processes for Additive Manufacturing, Mathieu Soulier et al. As presented at the Euro PM2021 Virtual Congress, October 18–22 2021, and published in the proceedings by the European Powder Metallurgy Association (EPMA)
LAST MONTH’S MOST-READ ARTICLES