

Corrosion and wear resistance of materials processed by beam-based AM technologies
A technical session at the World PM2022 Congress & Exhibition, organised by the European Powder Metallurgy Association (EPMA) and held in Lyon, France, October 9-13, 2022, focused on the corrosion and wear resistance of materials processed using beam-based Additive Manufacturing. This session comprised three papers which looked at ways to improve these properties – both particular pain points for AM's wider adoption – by way of chemical-mechanical surface polishing, adjusted laser power, and the development of new, wear-resistant alloys for AM. Dr David Whittaker reviews the presented papers. [First published in Metal AM Vol. 8 No. 4, Winter 2022 | 25 minute read | View on Issuu | Download PDF]
Chemical-mechanical surface polishing to improve mechanical performance and corrosion resistance
The first paper presented in this session came from Agustin Diaz and Patrick McFadden from REM Surface Engineering, USA, and Matias Garcia-Avila and John Scovill of ATI Specialty Materials, USA, and addressed the surface texture optimisation of metal additively manufactured components by chemical-mechanical polishing to improve mechanical and corrosion resistance [1].
Fatigue performance and corrosion resistance requirements are two of the most problematic aspects in the Additive Manufacturing field. The main reasons for failures in these two aspects are the close relationship between surface texture and the usual surface-related defects (SRD), such as partially melted/sintered powder, v-notches, remnants of melt pools (fish scaling), and remaining support structures. These defects can reduce corrosion performance and cause fracture initiation sites. For most medical, aerospace, space exploration, and many other applications, these defects can limit applicability. The main objective of the reported study was to showcase a combination of surface finishing techniques developed for metal Additive Manufacturing workpieces, capable of improving surface waviness, roughness, corrosion resistance, and mechanical properties under cyclic loading.
For components additively manufactured via Powder Bed Fusion (PBF), the stress raisers that compromise fatigue lifetime are largely hidden below an accumulation of partially melted/sintered powder at the surface. It is well known that the cause of early failure is the accumulation of stress raisers at the surface, such as extreme surface roughness and v-notches. The other aspect that is often associated with surface roughness is the material’s corrosion resistance. Surface texture features in PBF components can be associated with different corrosion issues (e.g., pitting corrosion, crevice corrosion, or fretting). It has also been established that, due to the strong correlation between SRD and the corrosion resistance of components, it can be anticipated that the corrosion resistance would be significantly improved after an appropriate surface finishing operation.
The other aspect that compromises structural integrity of PBF components is the accumulation of sub-surface porosity at the near surface. A contour scan, comprising one or more electron or laser beam passes, can be employed during the build process to delimit the part surface from the part’s internal structure. When the contour process parameters are not optimised, sub-surface porosity is generated, reducing the relative density of the material and compromising mechanical performance. Also, there are instances where the issue is not within the contour scan line, but, instead, is within the overlapping settings between the contour and the hatching pass. Failure to produce a successful overlap between these two passes causes sub-surface porosity and lack of fusion at the near-surface. However, this internal porosity can be healed with a proper Hot Isostatic Pressing (HIP) procedure. Therefore, any subtractive surface finishing operation should improve mechanical and corrosion resistance if a post-processing heat treatment capable of remediating the sub-surface porosity, such as HIP, is performed beforehand.

Many of the potential post-process methods for the improvement of surface texture are inapplicable for Additive Manufacturing components, because of the technology’s freeform capability and resultant complex geometries, including internal passages, cavities and channels.
The reported work has focused on the effects of surface finishing of PBF-built metal components, using a combination of technologies that have demonstrated the potential to eliminate or reduce surface-related defects, involving chemical-mechanical polishing. Examples of such finishing treatments for Electron or Laser Beam Powder Bed Fusion (PBF-EB and PBF-LB, respectively), were showcased to demonstrate the process’s capabilities. Case studies for PBF-EB Ti-6Al-4V, PBF-LB GRCop-42, and PBF-LB IN625 were selected as examples.
The specimens used for the study were additively manufactured vertically (90° with respect to the building platform) using the two different PBF types. Specimens were additively manufactured with and without contours.
The surface finishing process was performed by REM Surface Engineering, using their Extreme ISF Process®. This process combines a chemical polishing (CP) operation followed by a chemical mechanical polishing process (CMP). The CP was performed by immersion in a robot-controlled chemical polishing bath. The CMP was performed in a 30 L circular vibratory bowl with a mix of non-abrasive ceramic media. The chemistry and dosing used for CP and CMP, as well as the media mix composition, shapes, and sizes, are the proprietary information of REM Surface Engineering and were not disclosed in the presentation.
Turning to the first of the case study examples, Fig. 2 shows the surface texture progression during the CP process of an PBF-LB (Ti-6Al-4V) specimen with porosity problems at the contour/hatching overlap region. It can be observed that most of the surface-related defects were remediated during the first 100 μm of surface metal removal (SMR) (Fig. 2, top right). The partially sintered/melted powder was eliminated and the surface profile peaks were partially planarised. Further processing eliminated most of the peaks. The deep valleys that were still present were significantly shallower and rounded, with a considerable planarisation level at 150 μm of SMR. At 175 μm of SMR, porosity associated with an unsuccessful overlap between the hatching pass and the contour was uncovered. This could usually be remediated with further processing at the expense of more sacrificial metal. This type of problem can be prevalent if extra care is not taken during the build process. Nevertheless, using a relatively inexpensive, fast, and easy CP process can check if some problems like this, or lack of fusion at the near-surface, occurred during the manufacturing process.
![Fig. 2 Microscope images at 100 X magnification of the surface texture progression at different levels of surface material removal of PBF-LB (Ti-6Al-4V), with near-surface porosity problems exposed during the CP process (a–d), and 3D microscope image of the surface at 150 μm surface metal removal (e) [1]](http://www.metal-am.com/wp-content/uploads/sites/4/2022/12/fig-02-7-855x1024.jpg)
The second part of the surface finishing process is the CMP, which involves using a specialised chemical formulation capable of producing a weak amorphous layer at the surface that is easily removed under minimal mechanical action, such as the media’s rubbing action in a standard vibratory bowl, accelerating the surface material removal rate. As a result, there is no need to use abrasive media that can be problematic in specific applications due to the possible introduction of inclusions into the sample’s surface and the risk of extra rounding on edges, delicate features, and corners.
Fig. 3 shows the surface texture optimisation progression for PBF-EB Ti-6Al-4V specimens through the surface finishing operations. The as-built components showed typical surface texture features (Ra = 28 + 1 μm) that were eliminated through the CP process by removing 350 μm from the surface. The CP process reached a plateau and no significant change was observed upon further processing. At that point, the specimens were processed by CMP to achieve the required planarisation to target the required Ra. For the HCF (high-cycle fatigue) specimens built with contour and without contour, the Ra target was below 0.1 μm and Ra = 0.07 + 0.02 μm for the contour specimens and Ra = 0.06 + 0.01 μm for the specimens without contour were obtained with the same SMR of 487 μm. Both samples showed the same surface material rates and level of planarisation. Some random porosity was observed in both samples, even though they were HIPed, probably due to small spots lacking fusion, but these were sporadic.
![Fig. 3 Microscope images at 100 X magnification (a and b) with their 3D representations (c and d) of the surface of PBF-EB Ti-6Al-4V as-built tensile specimens, and the final surface after surface finishing (b and d). Average surface roughness (Ra) progression per surface material removal through the surface finishing operation (bottom). The blue area on the plot shows the CP progression and the red area shows the CMP progression [1]](http://www.metal-am.com/wp-content/uploads/sites/4/2022/12/fig-03-7-742x1024.jpg)
High-cycle fatigue testing was carried out on the PBF-EB Ti-6Al-4V specimens to study the difference between samples with and without a contour. The results showed that, at 275 MPa, both sets of specimens were stopped with no failure at 1,728,000 cycles, but, for the specimens run at 600 MPa, there was a significant difference in the cycles to failure between the contour specimens (Nf = 22,000 + 9,000 cycles) and the specimens without contour (Nf = 6,000 + 2,000 cycles). This demonstrated the importance of the contour process, where the contour specimens showed a higher fatigue lifetime, even though the contour layer served as a sacrificial layer during the 487 μm material removal.
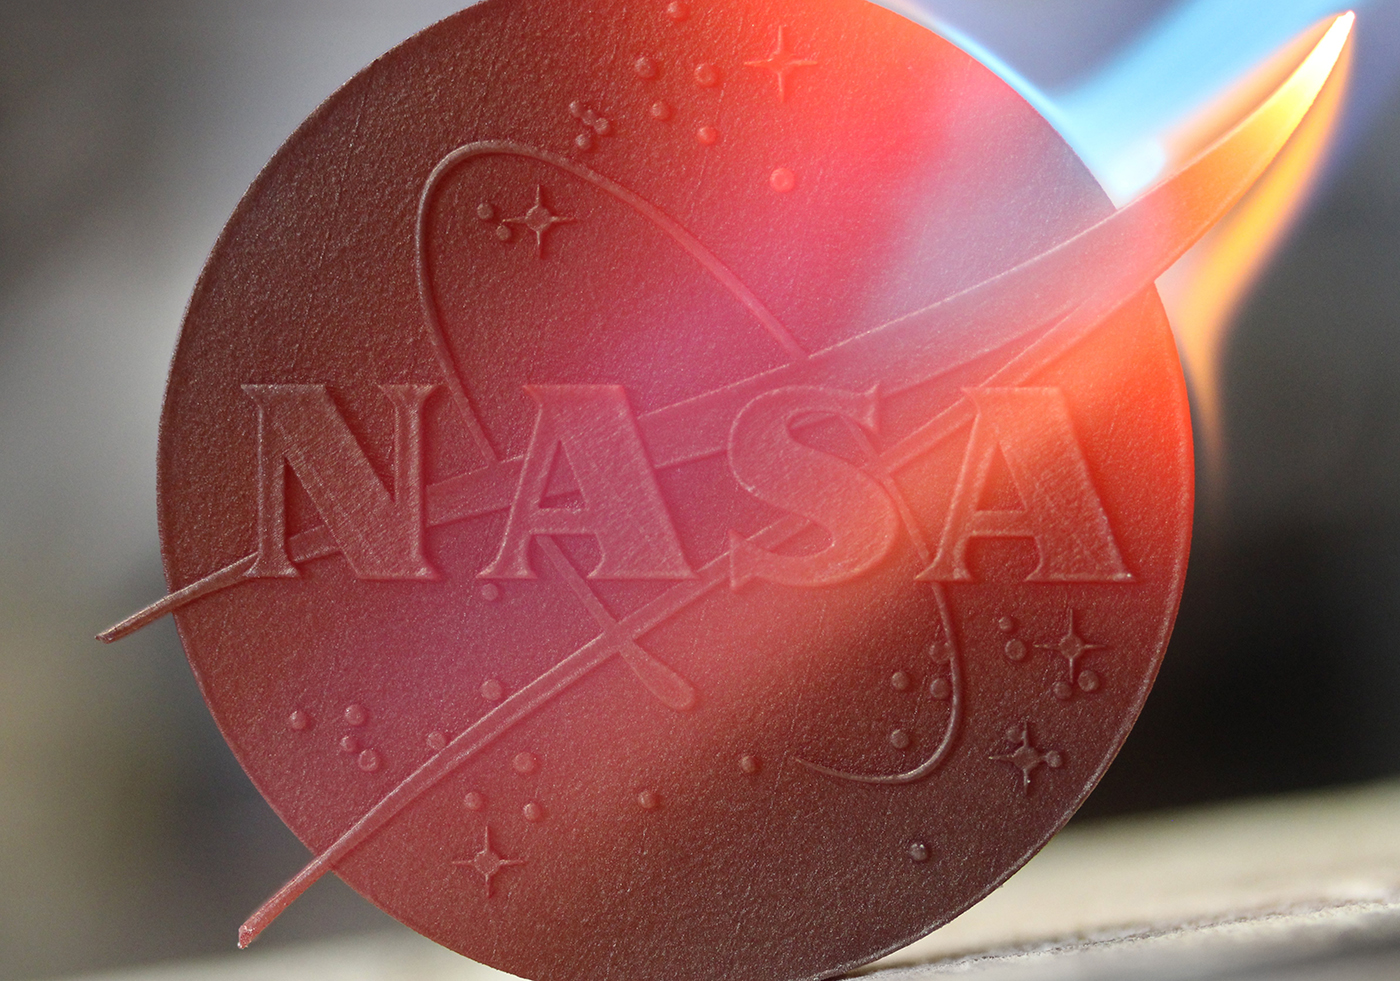
The second case study focussed on PBF-LB GRCop-42 (Cu-4%Cr-2%Nb). GRCop-42 is a high-strength, dispersion-strengthened copper alloy with excellent conductivity, currently used in liquid rocket engines by NASA and other commercial space companies. Fig. 4 shows the surface texture progression for typical non-HIPed specimens of this alloy through the surface finishing operations. The as-built components show surface texture features overtaken by the partially sintered/melted powder on the surface, with Ra = (18 + 2) μm. The initial surface texture improved remarkably through the CP process; in this specific example, by removing around 200 μm from the surface, a Ra reduction of up to 78% was achieved; followed by the CMP process, reaching the lower possible Ra, where values under 0.6 μm were achieved (Fig. 4).
![Fig. 4 Average surface roughness (Ra) reduction per surface material removal through the surface finishing operation of PBF-LB GRCop-42, first CP followed by CMP (a). The blue area on the plot shows the CP progression, and the red area shows the CMP progression [1]](http://www.metal-am.com/wp-content/uploads/sites/4/2022/12/fig-04-7-1024x921.jpg)
Finally, the PBF-LB IN625 case study was considered. The surface texture optimisation was performed by removing 400 μm from the surface by CP followed by 100 μm by CMP. The initial surface roughness of the as-built specimens was Ra = (8.3 + 0.5) μm and Ra = (7.5 + 0.2) for the HIPed samples. After applying CP + CMP, the final surface roughness was Ra = (1.1 + 0.6) μm for the non-HIPed samples and Ra = (0.07 + 0.01) μm for the HIPed samples. The non-HIPed sample surfaces showed significant shallow pits from the overall porosity, while the HIPed samples’ surfaces were perfectly smooth.
Fig. 5 shows the results of mechanical testing experiments performed on PBF-LB IN625 specimens. The tensile and yield strengths of the specimens were significantly reduced upon HIPing. Nonetheless, the surface finishing process increased these for both non-HIPed and HIPed samples and, in the case of the HIPed samples, the strength lost on HIPing was recovered. However, upon surface finishing, a significant decrease in elongation was observed. The observed effects on the tensile properties can also be associated with the residual compressive stress imparted to the material upon surface finishing. On the other hand, the effects of HIPing and surface finishing on fatigue properties were extremely significant, showcasing the importance of combining surface finishing and HIPing. Surface finished non-HIPed samples did not show a significant improvement in fatigue. The same was the case for HIP samples with no surface finishing.
![Fig. 5 Tensile strength (a), 0.2% yield strength (b), elongation (c), and uniaxial tensile high-cycle fatigue (Load at 434 MPa, room temperature, R = 0.1, and 60 Hz) of PBF-LB IN625 specimens before and after surface finishing and HIPing [1]](http://www.metal-am.com/wp-content/uploads/sites/4/2022/12/fig-05-7-774x1024.jpg)
Influence of laser power on corrosion behaviour of PBF-LB Mg-Y-Nd-Zr alloy
The second paper, presented by Hanna Nilsson Ahman and Pelle Mellin (Swerim AB, Sweden) and Clarence Wahman and Cecilia Persson (Uppsala University, Sweden), considered the influence of laser power on the corrosion behaviour of a Mg-Y-Nd-Zr alloy, processed by Laser Beam Powder Bed Fusion.
Magnesium and its alloys were first investigated for their possible use as biodegradable orthopaedic implants early in the 20th century and the first biodegradable metal implant to obtain a CE certification was an orthopaedic screw produced from a powder-extruded Mg-Y-Nd-Zr alloy.
PBF-LB of magnesium alloys was first shown to be feasible in 2010. The possibility of additively manufactured complex structures of a Mg-Y-Nd-Zr alloy was first demonstrated in 2016 and a thorough investigation of the microstructure was published in 2019. Moreover, the mechanical properties have been shown to match those of the powder-extruded Mg-Y-Nd-Zr alloys. However, for Mg-Y-Nd-Zr alloys processed by PBF-LB, corrosion rates of the bulk material remain too high, currently being around 2-3 mm/year, while a degradation rate of 0.5 mm/year is the currently recommended limit. Secondly, Mg alloys degrade with H2 gas as one of the main corrosion products. The amount of H2 gas formed needs to be controlled, as too high a gas evolution can have an adverse effect on bone remodelling. A limit of an average H2 gas evolution rate of 0.01 ml/cm2 per day has been suggested.
In order to tackle the problem of the excessive corrosion rates of Mg-Y-Nd-Zr alloys processed by PBF-LB, a greater understanding of the influence of the process parameters on corrosion properties is needed. The authors believe that there have been no studies to date on the influence of the individual process parameters on the corrosion properties. Therefore, the aim of the reported study was to investigate one of the most important parameters, namely the influence of laser power on the corrosion rate.
A gas atomised Mg-Y3.9wt.%-Nd3.0wt.%-Zr0.49wt.% alloy metal powder with a particle size range of 25-64 μm was processed by PBF-LB with a constant flow of argon running across the build bed. The oxygen content in the build chamber was kept below 0.1 %. For the production of the samples, the process parameters kept constant included a layer thickness (d) of 20 μm, a laser speed (v) of 1100 mm/s and a hatch distance (h) of 40 μm. The scanning direction was rotated by 67° between each layer. The laser power was varied between 60 W, 80 W and 90 W. Cylindrical samples, measuring 10 mm high and with a diameter of 5 mm, were additively manufactured.
Five samples from each sample group were additively manufactured and cut from the build using dry cutting to avoid the as-built surfaces being exposed to any reactions with cutting fluid. A cutting speed of 20 mm/s was applied using medium forces, and the sample was oscillated during cutting to minimise heating of the samples. The samples were then washed in an ultrasonic bath for 10 min immersed in ethanol.
An image of a representative additively manufactured cylindrical sample exhibiting the as-built surface after the ultrasonic bath washing is shown in Fig. 6 a). The results for the surface roughness analyses of the as-built surfaces of the three sample groups are presented in Fig. 6 b). The results show that a higher surface roughness was obtained for the samples produced with 60 W laser power, followed by the 80 W and finally 90 W. This shows that a lower laser power results in a higher surface roughness. In previous studies on other alloys processed by PBF-LB, it was observed that the surface roughness of the top surface can either decrease or increase with increasing laser power, depending on the other process parameters. Incomplete melting of powder is a plausible reason for the difference in surface roughness observed in this study.
![Fig. 6 Average results from the measurements of the surface roughness, Sa, of the as-built cylinders [2]](http://www.metal-am.com/wp-content/uploads/sites/4/2022/12/fig-06-6-1024x496.jpg)
Optical micrographs of the cross-sections of the edges of samples are shown in Fig. 7. In the image of the sample produced with 60 W power, large internal pores are visible throughout the bulk of the material (Fig. 7 a). These large pores appear to be due to a lack of fusion (i.e., not enough energy is put into the material to melt it completely), the same effect causing the higher surface roughness. No significant difference can be observed between the samples produced with 80 W and 90 W power (Figs. 7 b and c respectively). The images of both samples show some small circular pores in the bulk of the material, measuring around 10 μm or below. These types of pores generally occur either through a key-hole effect related to an unstable melt pool, or they could come from pores present in the powder. In this instance, either source is a possibility, as there were pores present in the powder and the magnesium is generally an unstable material. Moreover, the higher surface roughness of the 60 W sample, as measured by confocal microscopy, is also visible in these images, while no discernable differences can be seen for the 80 W and 90 W samples.
![Fig. 7 Optical micrographs of the cross-sections of the samples, with the samples additively manufactured with 60, 80 and 90 W laser power [2]](http://www.metal-am.com/wp-content/uploads/sites/4/2022/12/fig-07-6-1024x253.jpg)
The SEM images of the edges of the cross-sections of the samples are shown in Figs. 8 and 9. Representative images of two regions with different microstructures seen in the samples can be observed at a high magnification in Figs. 8a and b. The first is presented in Fig. 8a, where the melt pool structures observed in previous studies of Mg-Y-Nd-Zr alloys processed by PBF-LB are clearly distinguishable. This includes the clearly distinguishable melt pool boundary, as well as the planar structure within the melt pool. Around the edges of the cells, there are phases that appear brighter in the SEM images, which, in previous studies, have been shown to be Mg-rare earth intermetallic phases (RE = Y and Nd). The oxide flakes dispersed throughout the microstructure have also been noted in previous studies, which have shown that this type of structure usually corresponds to larger grains with a strong basal structure. In Fig. 8b, two other features of the microstructure can be detected. Firstly, there are star like formations and, secondly, there are more randomly organised Mg-RE intermetallics, corresponding to a dendritic structure. This type of region has previously been shown to contain smaller equiaxed dendritic grains with sizes in the range of a few μm. The secondary phases in the form of Mg-Re intermetallics also appear in larger agglomerates in Fig. 8b in comparison with Fig. 8a.
![Fig. 8 SEM images of the two types of microstructure observed at a high magnification: a) shows the oxide flakes, the melt pool boundaries and a cellular structure within the melt pool; b) shows the starlike shapes and a random network of secondary phases, corresponding to a dendritic structure [2]](http://www.metal-am.com/wp-content/uploads/sites/4/2022/12/fig-08-4-1024x354.jpg)
Comparing the microstructures along the edges of the three samples, representative of the three groups, in the SEM images of Fig. 9, it can be seen that the sample produced with a laser power of 60 W mainly exhibits the microstructural features of Fig. 8a, while, for the samples produced with 80 W and 90 W power (Fig. 9 b and c), the microstructural features highlighted in Fig. 8b are more prevalent. These features are also visible in some regions along the edges of the sample produced with 60 W, but not to the same extent. Comparing the samples produced with 80 W and 90 W power, the structure highlighted in Fig. 8b appears to be more dominant in the 90 W sample than in the 80 W sample. In the bulk of the material, it is the microstructure presented in Fig. 8a that is the most prevalent for all samples.
![Fig. 9 SEM images of the cross-sections of the samples, with the samples additively manufactured with 60, 80 and 90 W laser power [2]](http://www.metal-am.com/wp-content/uploads/sites/4/2022/12/fig-09-4-1024x284.jpg)
The reason for these differences in microstructure between the samples has not been fully established by the authors. However, the higher laser power contributes with two effects. The first is the higher volumetric energy input. As the difference between the melting point (Tm = 650°C) and the boiling point (Tb = 1050 °C) is very narrow for Mg, and the vapour pressure is also very high, Mg evaporation is observed for all samples during Additive Manufacturing. However, a higher amount of evaporation product is generally observed for the higher energy densities. This would lead to a greater shift in the alloying content, causing the precipitation of higher amounts of intermetallic particles.
A second effect of higher laser power is the difference in width and depth of the melt pool and this means a larger heat affected zone. The material is remelted and reheated more times, which could cause the precipitation and growth of secondary phases. The higher energy input also affects the thermal conditions in the material during Additive Manufacturing and can thus affect which types of microstructures are formed. The formation of equiaxed dendritic grains usually implies a homogeneous nucleation and growth, which usually takes place at slower cooling rates where there is time for segregation of elements. This would explain the higher presence of this type of structure along the edges of the additively manufactured pieces, where there is contact with the unmelted powder, as the unmelted powder has a much lower heat conducting capacity than the bulk. This would also explain the larger amount of the type of structure being present in the sample printed with a higher laser power.
The corrosion properties of the as-built surfaces were investigated using a Phosphate Buffered Saline solution as the corrosion medium. All corrosion measurements were carried out at 37°C to mimic biological conditions in the body. The corrosion rate was characterised by the hydrogen evolution rate, measured using a volumetric set up.
The results from the hydrogen evolution tests are presented in Fig. 10 and show that the samples additively manufactured with a laser power of 90 W have the highest hydrogen evolution rate, followed by the 80 W and finally the 60 W. This was unexpected, as the samples produced with 60 W had both the highest surface roughness and the largest internal pores, as well as the highest number of pores.
![Fig. 10 The results plotted from the hydrogen evolution tests [2]](http://www.metal-am.com/wp-content/uploads/sites/4/2022/12/fig-10-4-1024x618.jpg)
The reason for the 60 W power samples exhibiting the lowest corrosion rate could be related to the size and amount of the secondary Mg-RE phases observed in the SEM images. The increase of Mg-RE intermetallic phases has previously been shown to have a detrimental effect on the corrosion properties of Mg alloys, because the Mg-RE phase has a higher corrosion potential than the Mg matrix. In aqueous solutions, the intermetallic phases work as local cathodes and give rise to an increased micro-galvanic corrosion.
These results indicate that, to a certain extent, the size and distribution of the secondary phases are more important than the surface roughness and internal porosity, at least when looking at the corrosion rate over twenty-eight days. Nevertheless, both surface roughness and pores are known to have an important adverse effect on the mechanical properties of materials processed by PBF-LB in general and for Mg alloys specifically. The effect of surface roughness on mechanical properties can be mitigated by various surface treatments such as chemical polishing. The internal pores of the samples produced at 60 W power, however, may have to be decreased to ensure sufficiently high mechanical properties.
Thus, the authors have proposed that future studies should include optimisation of the microstructure near the surfaces through the development of optimised PBF-LB process parameters of contours. Moreover, further focus should be put on understanding the effect of the main PBF-LB process parameters on the formation of the two types of microstructures observed in this study.
Development of wear resistant alloys for PBF-LB
The final paper in the session turned to the issue of wear resistance of PBF-LB materials. Corina Junghetu (Hoeganaes Corporation Europe, Romania) and Chris Schade and Tom Murphy (Hoeganaes Corporation, USA) highlighted the company’s development of a suite of wear resistant alloys for use in Laser Beam Powder Bed Fusion.
In general, hard materials for tooling and wear resistant applications are very difficult to machine, with the most common forming method being grinding. Utilising a grinding operation severely limits the shape of the final product. Additive Manufacturing, and PBF-LB in particular, allows intricate shapes to be formed for most alloy materials and enables low-cost prototyping of small wear-resistant components. These prototypes can be placed in service to collect data on the performance of both the material and design of the part. This can be done without incurring large costs due to moulds or machining of very hard materials. The design features of Additive Manufacturing lend themselves to creating parts that could not be produced simply by grinding the shape from a block of metal. Therefore, there is great potential in utilising Additive Manufacturing for producing serial parts for industrial use.
The reported study documented and introduced a new family of alloys called Ancorwear. These materials were designed specifically for PBF-LB and cover a hardness range that mimics wrought alloys available for wear resistant applications. The mechanical properties of these alloys, as well as case studies and wear testing, have been reviewed to demonstrate applicability to real world applications.
Several alloys have been developed, covering a range of hardness and ultimate tensile strength values. There are a number of factors to be considered when choosing an appropriate alloy for an application. These can include: the structural properties, operating temperature, atmosphere or corrosion resistance and toughness. The main starting point for these attributes is the chemical composition of the alloys, as shown in Table 1. Ancorwear 500 and 600 are alloys made to mimic conventional wrought, abrasion-resistant grades commonly produced in plate steels. These grades of steel are typically difficult to form and are used in fairly simple shapes. Ancorwear SPL is a chromium/nickel-free alloy similar to the 500 and 600 grades but is designed to meet health and safety requirements where chromium and nickel are not permitted. S7 is a typical tool steel, but has the advantage of good impact and shock resistance; also, it has good resistance to softening at moderately high temperatures with an excellent combination of high strength and toughness. Ancorwear SS is a stainless steel that has high hardness, but provides abrasion resistance when moderate corrosion resistance is also needed.
![Table 1 Overview of alloy compositions evaluated in the study [3]](http://www.metal-am.com/wp-content/uploads/sites/4/2022/12/table-01-3-1024x228.jpg)
All powders used in this study were produced by gas atomisation, with the exception of Ancorwear SS, which was produced by water atomisation. All powders were screened to a nominal 15-53 μm particle size range, which is common for PBF-LB processing. Specimens for the study were processed by melting powder layer by layer with an Yb fibre laser (400 W) within an argon-filled chamber. Cubic samples (10 x 10 x 10 mm) were built with a variety of different settings to evaluate the porosity content produced for all the alloys listed in Table 1. A constant layer thickness was used for all samples, while the laser power, hatch distance and scanning speed were varied. Image analysis was used to measure the porosity content of the cross-section of the cubes perpendicular to the build direction. Settings for additively manufactured mechanical test specimens were chosen for all the alloys that led to a density of greater than 99%.
A set of standard settings was used to build dogbone tensile test specimens. Samples were cut from the build plate in the as-built condition after production. Tensile specimens were tempered for 1 h at 538°C in a nitrogen atmosphere prior to testing on all the grades except Ancorwear SS. This material was first heated to 1260°C for 30 min in nitrogen atmosphere and furnace cooled to room temperature. This heat treatment formed a dual phase microstructure of martensite and ferrite. Following the initial heat treatment at 1260°C, the Ancorwear SS was tempered at 538°C for 1 h in nitrogen to temper the martensite that was formed.
To determine the maximum hardness achievable in each alloy, tempering studies were performed on all materials. Due to the high level of residual stresses from the PBF-LB process and the nature of the alloys (high hardness), it was recommended that these materials should not be used in the as-built state. Tempering was performed at temperatures ranging from 300-760°C for 1 h in a nitrogen atmosphere. For each alloy, the tempering temperature, which achieved maximum hardness, is shown in Table 2. As expected, the S7 tool steel material has the highest hardness and lowest ductility. The Ancorwear 500, which is a hardenable low-alloy steel, but with a carbon content which lends itself to welding, has the lowest hardness but highest elongation, indicating a good toughness. The Ancorwear 600, which is more highly alloyed (nickel), including a higher level of carbon, has a hardness close to that of S7, but with a much higher level of ductility. The SPL, which has no nickel or chromium and a low level of carbon, has both high hardness and good ductility. The Ancorwear SS, which has low carbon (typical of stainless steels), has a HRC of 38, which is very high for a non-carbon stainless steel. The low carbon allows for a better corrosion resistance of this alloy compared to the other materials.
![Table 2 Mechanical properties of PBF-LB samples after tempering [3]](http://www.metal-am.com/wp-content/uploads/sites/4/2022/12/table-02-2-1024x378.jpg)
The microstructures of alloys 500, 600, SPL, and S7 were tempered martensite with varying concentrations of fine precipitated carbides in ferrite. The chemical compositions of each alloy, as shown in Table 1, control the size, composition, and concentration of the carbides, with the higher carbon contents resulting in a higher carbide population density compared with the lower carbon contents. In addition, the ferritic regions were larger and more distinct in the lower carbon samples.
The fifth alloy, Ancorwear SS, had a dual phase stainless steel composition. Mechanical and physical properties of this alloy type were developed by heating the as-built sample in the two-phase region of the phase diagram (ferrite and austenite) then cooling to transform the austenite to martensite. The martensite was tempered at 538°C before mechanical testing.
The alloys shown in Table 1 exhibit a range of hardness that could be used in a variety of applications. The initial case study presented related to the hammers and screens in a hammer mill for grinding materials. In order to investigate the use of PBF-LB, both the hammers and screens were additively manufacture from materials shown in Table 1, grinding trials were performed, and wear and lifetime of the AM parts were quantified. The material that was chosen to be ground was a metal alloy consisting of titanium-iron-manganese with a hardness of HV30 = 355.
For the field trials, Ancorwear SPL was chosen due to its high hardness but good toughness (as indicated by its elongation values). Since the hammers rotate at a high RPM, they need to have good impact toughness so that do not fail catastrophically. If a hammer were to shatter when operating at >3000 RPM, significant damage to the mill could occur. In addition to the hammers, the perforated screens were also additively manufactured via PBF-LB. Typically, because these screens are conventionally formed by rolling, the material cannot have a high hardness, as this would make forming difficult. However, since PBF-LB can produce the curved screen, a higher strength/hardness material was considered as a potential improvement. In order to have a direct comparison with the standard hammers and screens, an equal number of hammers and screens manufactured from both the standard process (machining and rolling) and PBF-LB were put in the hammer mill at equivalent positions. The wear and damage to each of the parts were monitored as a function of the amount of metal alloy that was ground.
Fig. 11 shows photographs of the hammers and screens. In the case of the screens, the process was stopped after grinding 470 kg of the metal alloy; the photograph on the left shows that the perforated hole diameter was much larger with the standard screen material when compared to the SPL material processed by PBF-LB. The right picture of the screens showed that the standard processed screens failed at 1153 kg of ground material, while the screen produced via PBF-LB was still serviceable. All hammers lasted the lifetime of the campaign and the weights were measured before and after the grinding campaign to gain an indication of the weight loss. The wear on the standard material was 19.4%, while the PBF-LB SPL alloy exhibited a weight loss of 25%. This difference in wear was not unexpected, as the hardness of the standard material was 49 HRC versus a hardness of 46 HRC for the Ancorwear SPL. Since the performance of the PBF-LB SPL was unknown, a conservative approach had been taken to have a more ductile material (lower hardness) in order to avoid catastrophic failure on the initial trials. While the wear rate of the SPL was higher, there were no catastrophic failures and there are further improvements in the heat treatments that can be undertaken to improve the hardness of the SPL.
![Fig. 11 Hammers and screens produced conventionally and by AM [3]](http://www.metal-am.com/wp-content/uploads/sites/4/2022/12/fig-11-2-875x1024.jpg)
A comparison of the two hammer microstructures is shown in Fig. 12. The upper two images are taken from the standard machined alloy hammer and the lower two from the SPL alloy hammer. In each pair of images, the left is from the core, while the wear surface is depicted in the right image. The core microstructures (left images) are substantially different. In the standard alloy, details of the well-defined lath martensite are clearly visible and are typical of a tempered low-carbon martensite. A representative area from the SPL alloy core shows evidence of a heavily tempered lath martensite, with large ferritic regions populated with a distribution of small carbides. This difference in microstructure accounts for the hardness disparity and was probably caused by the thermal history of the AM part. As stated earlier, the AM part was tempered at the conclusion of the build process at a temperature designed to attain the maximum hardness, but still have ductility to resist the impact. In building the hammer, as opposed to the substantially smaller tensile bar, the temperature within the part remains elevated for a longer time, due to the repetitive heating from the laser. Consequently, the part undergoes both a microstructural transformation during cooling from the melt and what may be considered a self-tempering as the part is continually reheated during the remainder of the build. Finally, at the conclusion of the build cycle, the hammer is tempered again at the predetermined temperature, which further tempers the already tempered microstructure.
![Fig. 12 Microstructures of the two alloys in the core of the hammer (left) and at the wear surface of the hammer (right). Top is the standard machined alloy and bottom is Ancorwear SPL [3]](http://www.metal-am.com/wp-content/uploads/sites/4/2022/12/fig-12-1024x848.jpg)
In the two wear surface images (Fig. 12, right), the white coating on the left side of each image is the built-up edge of the metal alloy powder on the hammer edge and the right side of each image is typical of the core, although at a lower magnification compared with the two core-only images. The microstructure differences are apparent, as is distortion to the microstructure in the form of flow of material from particle impact at the hammer edge during grinding. It is evident in these images that the flow and distortion in the Additive Manufacturing hammer is at a greater depth compared with the machined hammer, which may help account for more material being eroded from the surface during use, thus contributing to a greater weight loss.
Based on the knowledge gained from this initial pilot trial and the finding that the Additive Manufacturing material already undergoes self-tempering from repetitive scanning of the laser over the prior built layer, it was concluded that a more appropriate material selection for this application might have been Ancorwear 600. Fig. 13 shows the microstructure of Ancorwear 600 in the as-built condition and tempered at 315°C for 1 h. It is clear that the microstructure in both conditions is martensitic and more closely resembles the microstructure of the standard alloy. The Ancorwear 600 alloy has higher carbon than the other materials and, therefore, the hardenability of the alloy is greater and the hardness of the martensite that is formed is also greater when compared to the other alloys. The primary purpose of tempering is to impart toughness to the alloy. This occurs due to the relief of internal stresses caused by the formation of martensite and the precipitation and spheroidisation of carbides. Alloying elements have a direct effect on the latter. Elements such as manganese, nickel, and silicon have only a small effect, since they do not form carbides. Elements such as chromium, molybdenum and vanadium are known to enhance hardness at higher tempering temperatures by forming alloy carbides. The effectiveness of these elements depends on their solubility in austenite and the nature of the carbide formed. These alloying elements also retard the coalescence of carbides, leading to temper resistance. Nickel has a synergistic effect on the hardenability when added with chromium and molybdenum and is known to increase impact toughness for alloys with a martensitic microstructure.
![Fig. 13 Microstructures of Ancorwear 600 as built (left) and tempered at 315°C (right) [3]](http://www.metal-am.com/wp-content/uploads/sites/4/2022/12/fig-13-1024x420.jpg)
On comparing the mechanical properties of Ancorwear 600 and Ancorwear SPL, the ductility of the two materials is similar, while the hardness of the 600 alloy is greater. This, combined with the fact that the microstructure resists the tempering from the PBF-LB process, leads to a harder, more wear-resistant alloy that should also resist the impact seen in the performance of the grinding hammers.
Prior to running additional case studies with the Ancorwear 600, Charpy impact testing will be performed to ensure that the material will not fail catastrophically. In addition, wear tests, such as pin and disc, will be performed to correlate the wear rate test results and mechanisms (by metallography) with the actual operation of the hammers in the mill.
Author and contacts
Dr David Whittaker
Tel: +44 1902 338498
[email protected]
[1] Agustin Diaz, REM Surface Engineering, USA
[email protected]
[2] Hanna Nilsson Åhman, Swerim AB, Sweden / Division of Biomedical Engineering, Dept of Material Science and Engineering, Uppsala University, Sweden
[email protected]
[3] Corina Junghetu, Hoeganaes Corporation Europe, Romania
[email protected]
References
[1] ‘Surface Texture Optimization Of Metal Additive Manufactured Components Through Chemical-Mechanical Polishing To Improve Mechanical And Corrosion Resistance Performance,’ Diaz, A, et al. As presented at the WorldPM 2022 Congress, October 9–13, 2022, and published in the proceedings by the European Powder Metallurgy Association (EPMA).
[2] ‘ Influence Of Laser Power On The Corrosion Behavior Of A Mg-Y-Nd-Zr Alloy Produced By Powder Bed Fusion – Laser Beam,’ Nilsson Åhman, et al. As presented at the WorldPM 2022 Congress, October 9–13, 2022, and published in the proceedings by the European Powder Metallurgy Association (EPMA).
[3] ‘Development of Wear Resistant Alloys for Use in Laser Powder Bed Fusion,’ Junghetu, C, et al. As presented at the WorldPM 2022 Congress, October 9–13, 2022, and published in the proceedings by the European Powder Metallurgy Association (EPMA).
Euro PM2023
The Euro PM2023 Congress & Exhibition, organised and sponsored by the European Powder Metallurgy Association, will be taking place in Lisbon, Portugal, October 1–4, 2023.

LAST MONTH’S MOST-READ ARTICLES