

World PM2016: The non-destructive evaluation of internal defects and powder characterisation in AM
A collection of papers at the World PM2016 Congress, held in Hamburg, October 9-13, 2016, addressed the issues of non-destructive examination (NDE) of internal defects in additively manufactured parts and the control of AM processing through appropriate powder characterisation analysis. Dr David Whittaker presents Metal Additive Manufacturing magazine’s final report from the congress. [First published in Metal AM Vol. 3 No. 2, Summer 2017 | 20 minute read | View on Issuu | Download PDF]

Non-destructive evaluation of internal defects in additively manufactured aluminium parts
A paper, from Lars Pejryd and Patrik Karlsson (Örebro University, Sweden), Sebastian Hällgren (Saab Dynamics and Örebro University, Sweden) and Magnus Kahlin (Saab Aeronautics and Linköping University, Sweden), addressed the issue of NDE of internal defects in additively manufactured aluminium alloy, AlSi10Mg.
To enable the full industrial application of AM, robust methods for the detection of potential internal defects are required. X-ray computed tomography (CT) is potentially one of the few tools for non-destructive evaluation (NDE) of internal features and defects. The applicability of CT and other NDE methods is, however, not fully understood. In the reported work, aluminium alloy parts, with different sizes of controlled internal defects in the form of slots of varying width, 0.1–0.4 mm, were manufactured by Selective Laser Melting (SLM). The parts were produced either with a solid form or with internal networks. Both of these sample types contained the pre-designed defects and were used to evaluate the ability to detect the defects by CT, ultrasonic inspection and Eddy Current Testing (EC).
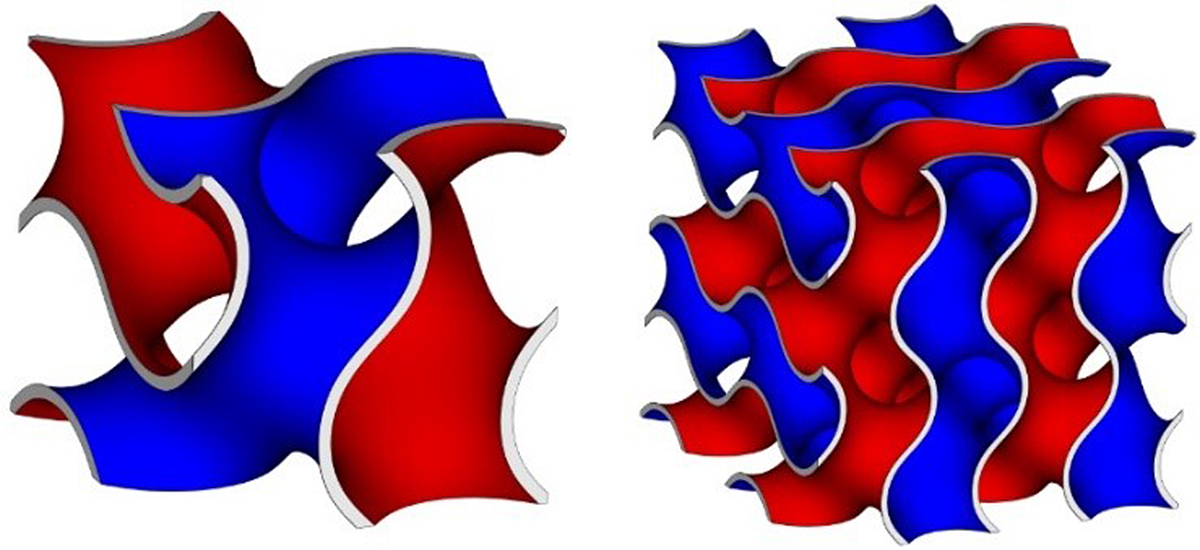
After the sample build process, two surfaces were machined to Ra 3.2 in order to improve ultrasonic and eddy current inspection. Three external half-spheres were added on top of the parts (relative to the build direction) for CT measurement calibration. In order to create the internally latticed part, additional geometries were designed by performing two subsequent boolean operations, using the software Magics. Lattice pattern, G_structure10, with structure dimensions x,y,z = 3.0 mm being chosen (Fig. 2). Both sample types were designed to contain the same type of pre-designed defects.
![Fig. 2 Design of the test object, in AlSi10Mg, without internal lattice network (top) and cut view of the internally latticed part (bottom left) and close-up of the lattice with a slot cutting through it (bottom right). The network strut’s square cross section dimension was measured to be nominally 0.78 mm [1]](http://www.metal-am.com/wp-content/uploads/sites/4/2017/06/02-1-1024x799.jpg)
Computed tomography was performed using an industrial CT system with a 225 kV X-ray micro-focus source. No physical filtering was applied to the X-rays. The scanning parameters used in the work resulted in a voxel size (i.e. the dimension of the volumetric pixel unit) of about 80 μm for scans of the complete sample and 27 μm for scans of only selected portions of the sample (at higher magnification). A filtered back-projection algorithm was used to reconstruct the investigated 3D volume based on the X-ray projections obtained. For separation of the aluminium material and air to determine the interfaces, thresholding of the reconstructed volume was carried out using commercial software with adaptive surface determination methods. The data were then used to determine the geometry and dimensions of the defects produced. Two types of approaches, defect determination and actual/nominal comparison, were used for the evaluation of the presence and size of non-melted areas in the form of slots.
Ultrasonic inspection was performed using immersion testing with both the transducer and the test sample placed in a water tank. During ultrasonic inspection, an ultrasound pulse is sent through the sample and the received echo is analysed. A 20 MHz probe and a focal depth of 31.75 mm between the transducer and the part were used.

Electromagnetic inductive inspection was performed through eddy current testing. During eddy current inspection, an alternating current is applied to a coil resulting in a magnetic field, which induces a current and magnetic field in the test artefact. A defect in the test artefact will change the induced current and this will then will be registered. A Phasec 3D flaw detector and frequencies between 700 Hz and 3 kHz were used, giving a penetration depth of 2-4 mm in aluminium materials.
For solid samples with slots, CT evaluation could detect all of the defects/slots that were designed to be included in the sample (Fig. 3). The slots were shown to contain unmelted powder and porosity between powder particles. For the wider slots, this is clearly shown as regions of lower density than the surrounding solid material. From Fig. 3, it is clear that, for wide slots, powder is accumulated in the lower part of the slot and two different areas with different densities can be detected. All of the designed defects were easily detected by visual inspection of the reconstructed CT data.
![Fig. 3 Magnification of regions of interest in a sample without internal network (a) The end of the sample with large width (as designed 0.40–0.30 mm). (b) The end of the sample with small width of the slots (as designed 0.13–0.10 mm). The green lines indicate the expected dimensions from the CAD source file [1]](http://www.metal-am.com/wp-content/uploads/sites/4/2017/06/03-1-1024x274.jpg)
The external half-spheres were used as reference objects and the distances between the manufactured slots and the volume of the slots were measured. Defect determination using the mode “Void” and the algorithm VGDefx in the software identified the complete volumes of unmelted powder. This includes both the volumes of higher and lesser density of the larger slot, as can be seen in Fig. 3a (as the green line) for the larger slots. Using the enhanced mode and basing the analysis on surface determination, the volume identified varies and is not consistent along the sample. For the larger slots, the defect is identified as the volume with the lowest density (the white lines in Fig. 3) and, therefore, only parts of the low density volumes/slots are considered.
The analysis mode “actual/nominal”, where the reconstructed CT volume is compared to the as-designed CAD file, is not designed to analyse internal defects. This was confirmed by attempts to use this mode on the sample without internal networks, but with manufactured internal slots. In this case, no clear measurement values of the internal defects/slots were obtained.

Manual measurement of the widths of the slots resulted in deviations from the CAD values, ranging from +110% for the small width features to +10% for the larger features. The uncertainties of the measurements are similar for all slot widths measured. This gives an indication of the geometrical accuracy limits of small size features in SLM processing of aluminium.
The ultrasonic inspection of the samples, without internal network structures, resulted in defects that were detected by applying the probe on both the machined surfaces, Fig. 4(a,b), and the as-printed surfaces, Fig. 4(c,d). However, ultrasonic inspection of the top surface of the sample, with an as-printed surface roughness, resulted in poor resolution due to a low signal-to-noise ratio, Fig. 4(d). In comparison to defect detection using CT, ultrasonic inspection showed lower resolution.
![Fig. 4 Ultrasonic inspection of the machined surfaces (a,b) and rough surfaces (c,d) of the test pieces where (a,c), (b) and (d) are the side, bottom and top surfaces respectively. The upper test pieces shown in the images (a-d) were heat treated prior to the ultrasonic inspection [1]](http://www.metal-am.com/wp-content/uploads/sites/4/2017/06/04-1-1024x422.jpg)
For samples with internal networks, CT evaluation, Fig. 5, was not as straightforward as for solid samples. Visual evaluation of the CT data showed clear slots for the wider slots. Since the sample was designed as an “open structure”, the unmelted powder was easily removed after the build process. Therefore, slots, which are wide enough to allow powder to run freely and which are connected to the open parts of the network structure, will not contain powder after the build process. This results in a larger contrast between the solid parts of the sample and the intended defects, as compared to the solid sample case, where the unmelted powder remains in the slots. However, it was much more difficult to detect narrower slots in this sample. Below 0.28 mm, the slots begin to be semi-closed due to partial melting of the intended openings.
![Fig. 5 Magnification of regions of interest in a sample with internal network. a) The end of the sample with large width (as designed 0.40–0.36 mm), b) The middle part of the sample, c) The end of the sample with small width of the slots (as designed 0.12–0.10 mm) [1]](http://www.metal-am.com/wp-content/uploads/sites/4/2017/06/05-1-1024x237.jpg)
Analysis methods in the CT software, such as defect determination, are not directly applicable for these types of structures. In this mode, the analysis tool is searching for defects inside solid volumes, thus, in this case, inside the network struts. For the semi-closed areas, no internal defects could be detected using this mode. Thus defects between unmelted powder particles were below the detection limit of the set up. With the use of the “Actual/nominal” comparison, Fig. 6, comparing the CAD file of the designed object to the CT data, some help in identifying defects could be obtained. However, no usable numbers for comparison could be obtained.
![Fig. 6 Regions of interest in a sample with internal network, using the analysis mode actual/nominal comparison in the CT analysis software [1]](http://www.metal-am.com/wp-content/uploads/sites/4/2017/06/06-1-1024x174.jpg)
Resolution and detectability is an important question in quality assurance and detection of defects using CT is highly dependent on the CT system, the material studied and the magnification that can be used (and, therefore, the voxel size that can be obtained). In previously reported work in the literature, for Ti6Al4V samples built using electron beam melting (EBM), CT scans with a voxel size of 10 μm showed that, with such a magnification, it was not possible to detect pores smaller than 25 μm and it was concluded that this could probably be considered as the low end of the detectability range for current industrial CT systems. In the current analysis, where the voxel sizes were between 27 and 80 μm, the detection limits for defects were larger. Intentional defects down to 100 μm could, however, be detected. Additionally, the dimensional accuracy of CT measurements is not yet fully understood.
Overall, the authors concluded that, for components with internal networks, more work is needed to develop CT inspection methods to enable automation or to assist a trained operator. At present, CT does, however, seem to be the most promising method for inspecting components with internal networks.
The ultrasonic inspection of samples with internal network structures indicated substantial difficulties in detecting the constructed defects. The inner structures were barely visible in the results from ultrasonic inspection. Hence, in comparison to ultrasonic inspection, CT is superior in the detection of complex inner structures and defects. Ultrasonic and eddy current methods have been shown to be not applicable for these types of designs, as current methods cannot handle the analysis of signal paths in network structures.
Evaluating flowability of Additive Manufacturing powders using the Gustavsson Flow Meter
Control of a number of the characteristics of the ‘raw material’ powders is of prime importance in ensuring an adequate control of the subsequent AM processing and two papers at the congress addressed this issue. The first of these papers specifically focused on characterisation of powder flowability and was provided by a Swedish consortium, Pelle Melin, Ola Lyckfeldt and Annika Strondl (Swerea), Peter Harlin (Sandvik Materials Technology), Håkan Brodin (Siemens Industrial Turbomachinery) and Henrik Blom (Carpenter Powder Products). Control over powder flowability is important in ensuring consistency in the re-coating process after each layer build in powder bed AM technologies.
In the reported work, the nickel-based alloys, Hastelloy X (HX) and Inconel 939 (IN939), were assessed in both the ‘virgin’ and ‘used’ conditions. When a component is built in an SLM machine, the fused powder is replaced with virgin powder and the remaining powder is typically mixed with the virgin powder for the next run. The used powder degrades somewhat and the resulting mixture is therefore slightly different compared to the virgin powder. The flowability often changes, reflecting altered surface characteristics and the formation/scattering of agglomerates, but, most importantly, the Particle Size Distribution (PSD) also changes. The way in which the PSD changes is dependent on the technology. A spreading type of powder dispensing favours small particles in the build chamber, as the large particles are pushed on top. Hence, larger particles are enriched in the used powder. A pouring type of powder dispensing could favour some particle range depending on flow inside the pouring device. At the same time, the chemical properties are degraded, mainly in terms of oxygen content, which increases with continual usage. Bulk density comparisons for the analysed powders are listed in Table 1. The increased density levels of the used powders should be noted.
![Table 1 The powders used in the reported study. CBD is the conditioned bulk density; BDtap50 is the bulk density after 50 taps [2]](http://www.metal-am.com/wp-content/uploads/sites/4/2017/06/t01-1-1024x290.jpg)
The flow characteristics of these powder batches were assessed using two funnel-based flow meters (the Gustavsson and Hall flow meters) and the Freeman FT4 powder rheometer.
For AM, powders with a fine sieving fraction are beneficial because these enable better dimensional accuracy and finer surfaces. However, it is well known that flowability is poor for finer powders and they are typically more difficult to dispense. The most widely used flow assessment method, the Hall flow meter, is lacking in applicability for such fine powders.
The Gustavsson flow meter is a better method for fine metal powders, which are not free-flowing. As can be seen in Fig. 7, the angle is steeper in the Gustavsson flow meter, compared to the Hall funnel. The hole at the bottom is also smaller, in order to obtain the same flow time as the Hall flow meter, for the reference powder Chinese emery.
![Fig. 7 The cross section of (left) the Hall flow mater and (right) the Gustavsson flow meter [2]](http://www.metal-am.com/wp-content/uploads/sites/4/2017/06/07-1-1024x631.jpg)
In the Freeman FT4 powder rheometer, flow energy is measured on a defined volume (25 ml) of powder by recording the resistance to a rotating blade moving downwards and upwards within the powder bed using a certain helix motion pattern. Eight repeated measures, with a conditioning cycle in between each measurement, were conducted and the 7th value was used in the reported results. With the Freeman method of measuring flow, the pushing and shearing behaviour of the powders are determined. In contrast, with the Hall and Gustavsson methods of measuring flow, the free-flowing aspects of the powders were measured. See Fig. 8 for an illustration of the rheometer.
![Fig. 8 Freeman rheometer FT4. Resistance to flow is measured as the powder is in motion [2]](http://www.metal-am.com/wp-content/uploads/sites/4/2017/06/08-1-1024x579.jpg)
All of the studied methods of characterising the flowability were able to distinguish between used and virgin and dried and non-dried HX and IN939. However, for the Hall flow meter, the differences were small, close to the magnitude of variability between separate runs. Used powder (Fig. 9) and dried powder (Fig. 10) flowed more rapidly. Furthermore, the Hall flow meter is only designed for free-flowing powders and flow could sometimes not be started with a single tap and some powder remained in the funnel after the flow stopped. As such, the measurement standard (ISO 4490 or ASTM B213-11) could not be correctly applied. The Gustavsson flow meter was more successful and robust. Some of the measurements for the Hall flow time in Fig. 9 were in fact from only two runs and, therefore, not according to the standard.
![Fig. 9 Results for Hall and Gustavsson flow times. Non-dried powders were analysed [2]](http://www.metal-am.com/wp-content/uploads/sites/4/2017/06/09-1-1024x582.jpg)
![Fig. 10 Results of Gustavsson flow time for non-dried and dried HX powder. Drying was done by maintaining 70°C overnight, in normal atmosphere [2]](http://www.metal-am.com/wp-content/uploads/sites/4/2017/06/10-1-1024x595.jpg)
The comparison of the results from the funnel methods and the Freeman method displayed something of a paradox. In the Freeman rheometer, the used powders appeared to have worse flow characteristics, while, in the Hall and Gustavsson flow meters, the used powders appeared to have better flow characteristics.This difference may be partly related to the fact that the funnel methods are constant mass methods, while the Freeman rheometer is a constant volume method. The used powders showed higher bulk densities (Table 1) owing to having more fines and wider particle size distributions. A higher density means there is a smaller volume to pass through the funnel and hence a faster time is recorded. In the Freeman rheometer, a higher density powder means there is a higher mass and therefore more particles should be sheared. However, this is not the complete explanation as, if the conditioned bulk density from Table 1 is used, the Hall and Gustavsson mass flow rates can be recalculated to volume flow rates and, on comparing these volume flow rates from the Hall and Gustavsson flow meters, the used powders still exhibit a better flowability. As such, what is really a better flowability is a matter of definition and the different methods do not actually measure the same aspects. It can be postulated that shear cell testing could be a better representation for the spreading type of dispensing in AM; while the funnel methods could represent flowability in a better manner in the pouring type of dispensing.
It may be concluded that, for pouring type dispensing, the Gustavsson funnel may be the preferred flowability assessment method, as the Freeman FT4 is an advanced instrument, which requires knowledge and correct handling, whereas Gustavsson flow time can, on the other hand, be applied in a fast production setting and can be used by most staff without much training. Use of the Freeman rheometer may, however, be justified when characterising flow in an AM system that uses a spreading type of dispenser.
Powders for Additive Manufacturing
A further paper, from Alexander Kirchner, Burghardt Klöden, Thomas Weißgärber and Bernd Kieback (Fraunhofer IFAM, Dresden, Germany), presented a comprehensive set of characterisation analyses for powders used in Selective Laser Melting (SLM) and Electron Beam Melting (EBM) processing.
Metal powders have crucial significance as the feedstock for both SLM and EBM. To ensure problem-free processing, a number of properties such as flowability, particle size and shape, apparent density and level of impurities have to be within certain ranges. Since, to date, powders have been largely supplied by the equipment manufacturer, systematic examinations are not available.
Therefore, four powders provided by manufacturers of SLM and EBM machines were analysed in the reported study. EOS Titanium Ti64 had a nominal particle size of 20-45 μm, Concept Laser CLM (15-45 μm), SLM Solutions Ti-6Al-4V (20-63 μm) and Arcam Ti-6Al-4V (45-105 μm).
To characterise the particle size distributions of these powders, a laser scattering analyser was used. For these measurements, the powders were dispersed in water using ultrasound. Flowability was characterised for 50 g of powder by means of a Hall flowmeter. Apparent density was determined by the funnel method and tap density was measured using a Scott volumeter Elemental composition was analysed using an inductively coupled plasma optical emission spectrometer (ICP-OES) and interstitial impurities were determined using a LECO analyser. Density was measured using a gas pycnometer with helium. Imaging of powder particles was carried out using a scanning electron microscope.
The SLM machines used in the study were an EOS Eosint M270, a Concept Laser M2 cusing and an SLM Solutions 250HL. EBM studies were carried out using an Arcam A2X machine.
![Table 2 Determined properties of Ti-6Al-4V powders provided by equipment manufacturers EOS, Concept Laser, SLM Solutions and Arcam [3]](http://www.metal-am.com/wp-content/uploads/sites/4/2017/06/t02-1024x717.jpg)
The characterisation results for the Ti-6Al-4V powders provided by the equipment manufacturers are given in Table 2. The measured particle size distributions are shown in Fig. 11. Using electron microscopy imaging, all powders were found to be highly spherical with very few satellites. Despite this very beneficial particle shape, all SLM powders require tapping to achieve a continuous flow in the Hall test. The apparent densities of the SLM powders were in the range 2.45 to 2.54 g/cm³ and the tap densities in the range 2.73 to 2.83 g/cm³. From these numbers, the Hausner ratios can be calculated to be in the range 1.15 to 1.11. All of these values are significantly below 1.25, pointing to sufficient flowability. The pycnometric density of all SLM powders was measured to be 4.40 g/cm³, indicating negligible internal porosity.
![Fig. 11 Particle size distributions of Ti-6Al-4V powders [3]](http://www.metal-am.com/wp-content/uploads/sites/4/2017/06/11-1024x670.jpg)
In comparison the EBM powder was characterised by a larger particle size. Consequently, flowability, apparent density and tap density were all higher than those of the SLM powders. The chemical compositions of all the powders tested fell within the ASTM B265 specification of Titanium Grade 5.
On the basis of these characterisation results, a custom powder specification was generated and custom specified Ti-6Al-4V powders were produced by electrode induction-melting gas atomisation (EIGA) using argon by TLS Technik, Germany.
In view of the distinct particle size differences between SLM and EBM powders, two powder fractions were specified. The finer fraction with a nominal size between 20 and 63 μm was to run on all SLM machines, while the coarser fraction between 40 and 120 μm was destined for the EBM process. The specified flowability of the SLM powders had to be aligned with the highest flowability measured for the powders supplied by the equipment manufacturers. Also, the elemental composition was specified to be tighter than ASTM B265 to take into account two effects. Firstly, the selective evaporation of aluminium from the alloy melt leads to a depletion in the manufactured Ti-6Al-4V part, and, secondly, there is oxygen uptake during the build process. Repeated heating leads to oxygen accumulation in the powder, potentially limiting the commercially important number of re-use cycles. In addition, the allowable internal porosity was tightly limited, since some of the gas-filled porosity translates into the final material. The results of the characterisation analyses of the two fractions, manufactured according to the custom specification by TLS, are presented in Table 3.
![Table 3 Determined properties of custom specified Ti-6Al-4V powders [3]](http://www.metal-am.com/wp-content/uploads/sites/4/2017/06/t03-1024x686.jpg)
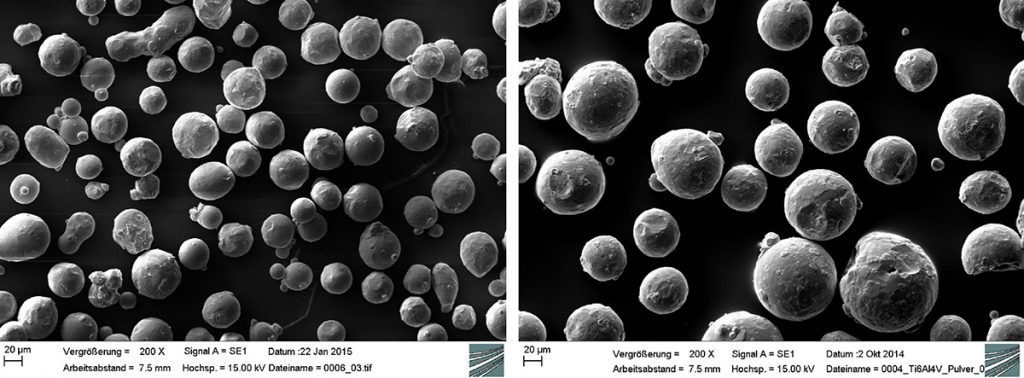
With a median D50 of 44.1 μm, the custom SLM powder is coarser than any of the previously analysed SLM powders and its flowability is, at 31.4 s, at the high end of the previously analysed range. The particle size distribution of the custom EBM powder is practically identical to the Arcam powder, but its flowability is inferior. The likely reason for this can be seen in Fig. 12. Both the custom SLM and EBM powders are less spherical than the previously characterised powders. This also affects both apparent and tap density, which are slightly reduced. The powder chemical composition leaves enough latitude to account for preferential aluminium evaporation and oxygen accumulation, as a consequence of recycling, to be within the ASTM B265 specification.
The custom SLM powder, after adjustments to the scan parameters, ran without issues on the three different SLM machines. The custom EBM powder was processed using Arcam standard parameters. No problems regarding powder feeding and raking were encountered. The built Ti-6Al-4V materials exhibited good mechanical properties.
Powder ‘ageing’ through repeated uses was monitored over a number of build series on different machines. After processing virgin SLM powder on an SLM Solutions machine, a number of subtle changes in powder properties were detected. While the median particle size stayed practically constant, the number of particles smaller than 30 μm was reduced over the first three cycles. Flowability was increased continuously such that, after six cycles, flow time was reduced to 28.6 s. While the effect on apparent density was negligible, tap density increased to a level of 2.73 g/cm³. A moderate increase in impurities was detected. The oxygen content rose to 0.138 % within six cycles or an average increase of 0.003%/cycle.
In the case of EBM, a small shift in particle size distribution of approximately 2 μm towards larger particles was measured after processing the powder for 13 cycles. No reduction in flowability was detected. As before, no change in apparent density was detected, but there was a small increase in tap density. The increase in oxygen content after 13 cycles was 0.027%, corresponding to 0.002%/cycle.
The authors’ overall conclusion was that their defined approach to custom powder specification was found to be suitable, on the basis that the powders’ performance in both SLM and EBM machines was as requested. Mainly subtle changes in the powder properties after multiple reuse cycles were detected. Because these ‘ageing’ effects depend on many factors, such as machine type, build geometry and processing parameters, they may not be readily applicable to every powder-bed-based additive manufacturing process and need to be checked individually.
In common with the previous reviewed paper, it was also concluded that, particularly for the finer SLM powders, the Hall flowmeter might not be the most suitable characterisation method for flowability
References
[1] Non-Destructive Evaluation of Internal Defects in Additive Manufactured Aluminium, L Pejryd et al, as presented at the World PM2016 Congress, Hamburg, October 11-14 2016, and published in the Proceedings by EPMA, UK.
[2] Evaluating Flowability of Additive Manufacturing Powders, Using the Gustavsson Flow Meter, P Mellin et al, as presented at the World PM2016 Congress, Hamburg, October 11-14 2016, and published in the Proceedings by EPMA, UK.
[3] Powders for Additive Manufacturing, A Kirchner et al, as presented at the World PM2016 Congress, Hamburg, October 11-14 2016, and published in the Proceedings by EPMA, UK.
Author
Dr David Whittaker is a consultant to the Powder Metallurgy industry.
Tel: +44 (0)1902 338498
Email: [email protected]
Proceedings
The proceedings of the World PM2016 technical sessions and poster program are published in digital format by the European Powder Metallurgy Association. For more information visit www.epma.com

LAST MONTH’S MOST-READ ARTICLES