

An introduction to metal powders for AM: Manufacturing processes and properties
As the Additive Manufacturing industry grows, so does the number of metal powder suppliers and the range of different powder types that are available. In the following article Toby Tingskog presents a beginners’ guide to understanding metal powders for AM. Topics include powder manufacturing processes, sphericity, chemistry and measurement technologies, as well as considerations in relation to heats, lots and batches. As such, it is hoped that this review will allow for a clearer understanding of powder properties and reduce confusion among end-users. [First published in Metal AM Vol. 4 No. 2, Summer 2018 | 20 minute read | View on Issuu | Download PDF]
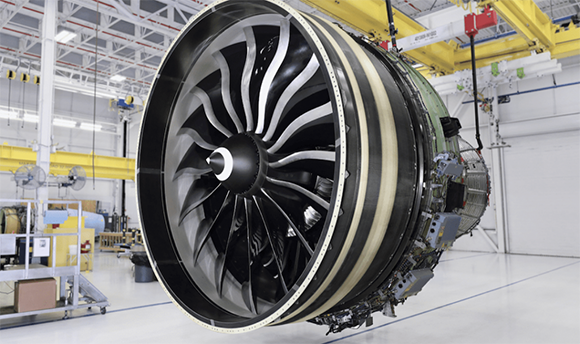
Metal powders have been used in a wide range of industrial applications for over a hundred years; Additive Manufacturing is just the latest sector to benefit from a technology that has evolved throughout this time. Metal powders are used from the most mundane applications such as oxygen getters in food packaging to the most advanced applications such as nickel-cobalt superalloy gas turbine discs.
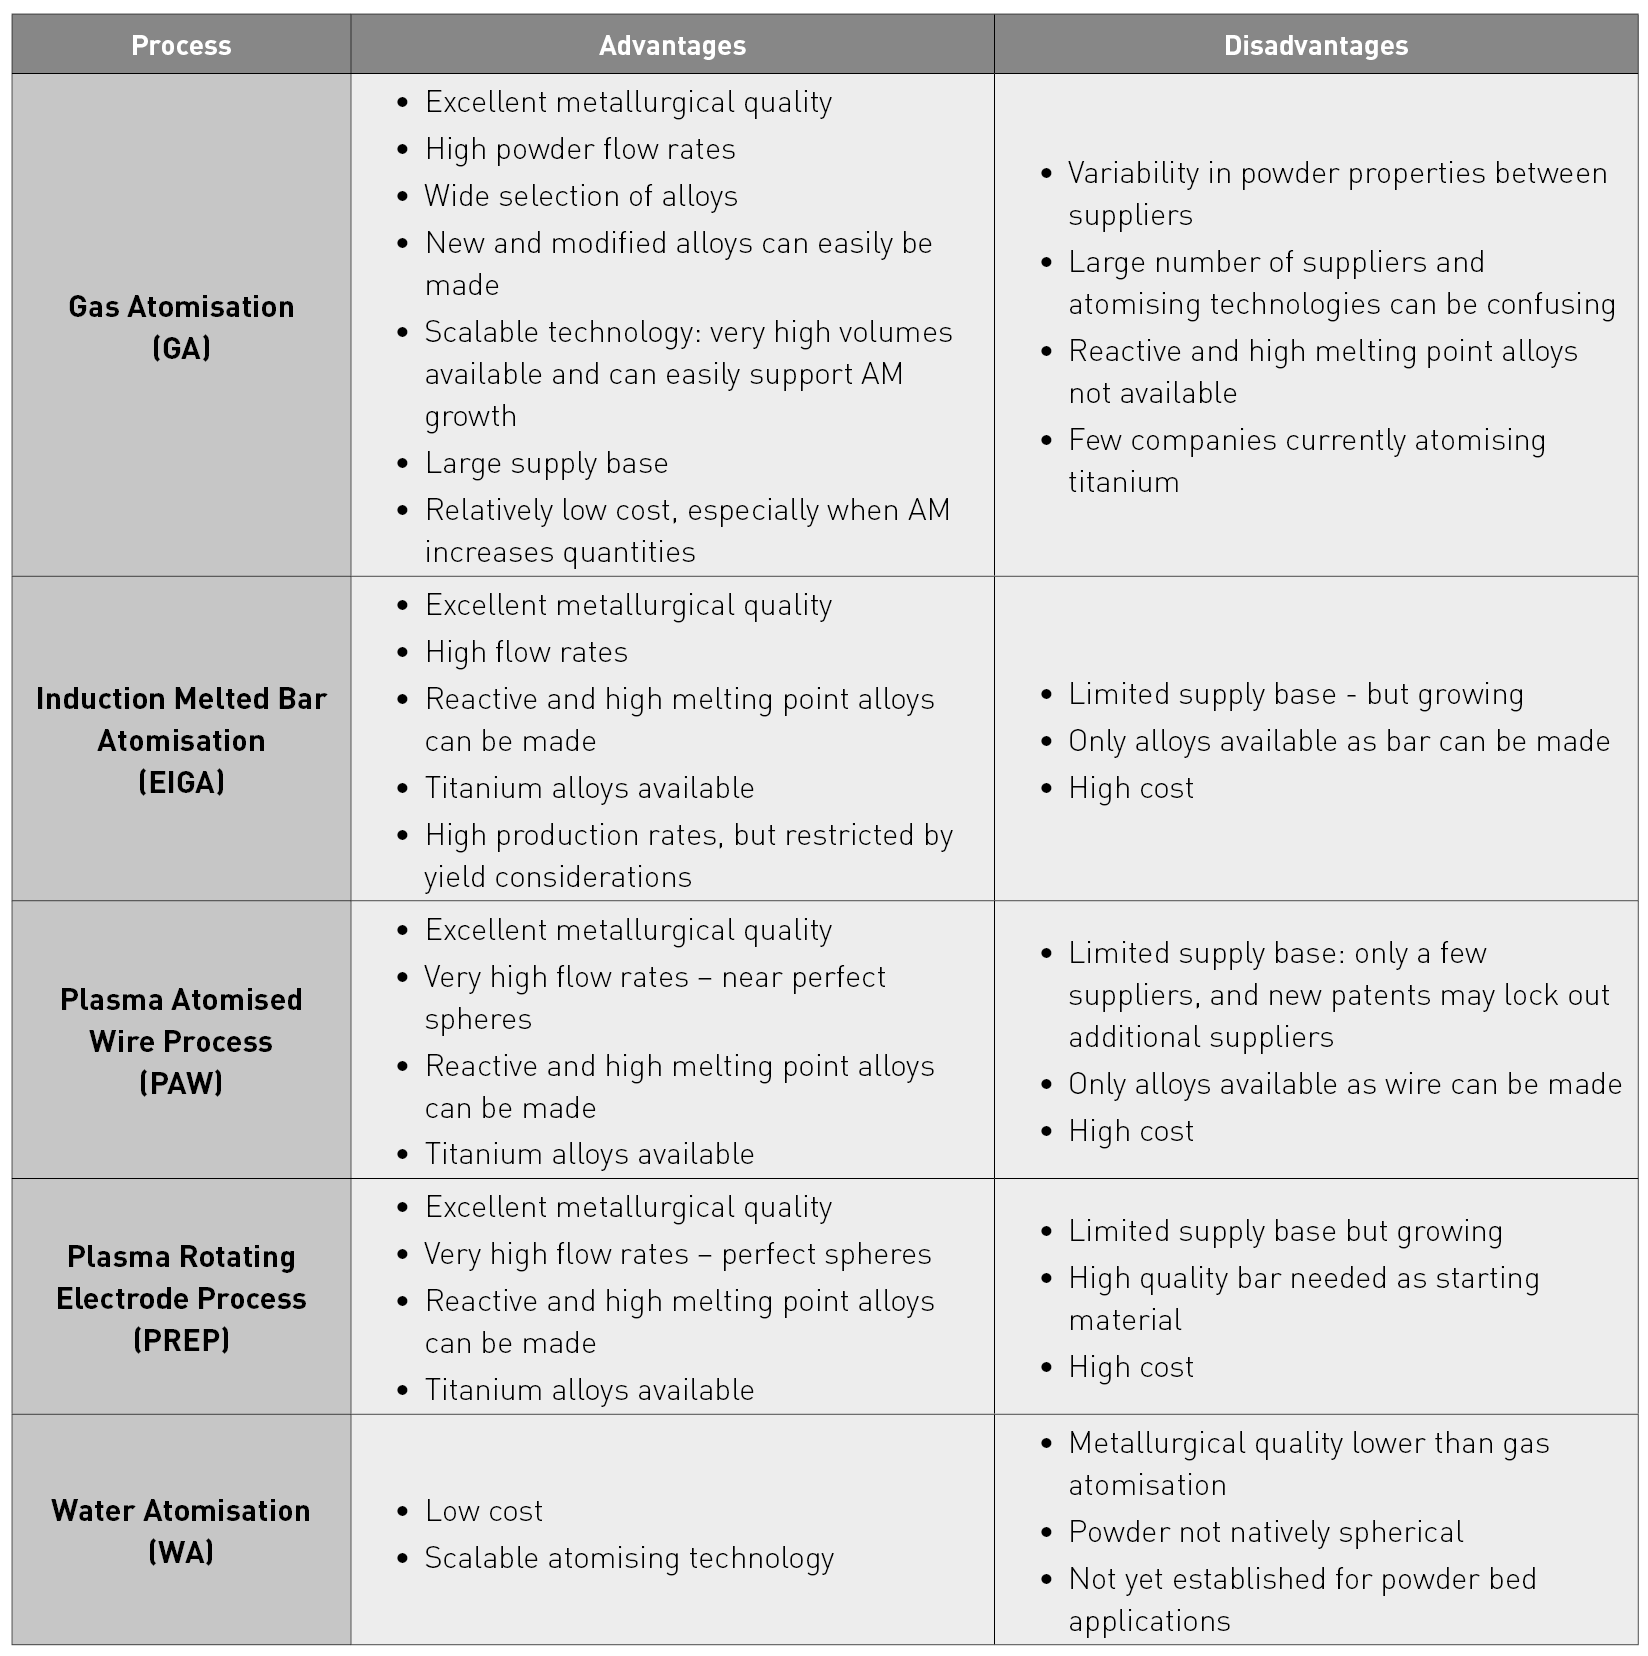
The major manufacturing processes for AM powders are Gas Atomisation, Induction Melted Bar Atomisation (EIGA), Plasma Atomised Wire (PAW) (Fig. 1) and Plasma Rotating Electrode Atomisation (PREP). There are, of course, many other methods for the manufacture of metal powders. Additional powder production routes which can be used for selected Additive Manufacturing processes include water atomisation, crushing and spheroidising, and precipitation from chemical solutions and gas phases. The advantages and disadvantages of the major processes are shown in Table 1.
Metal powder production processes for Additive Manufacturing
Gas Atomisation
In Gas Atomisation, a molten metal stream is disintegrated into droplets by a high-pressure gas stream. The drops free fall inside a tower and solidify before collection. During free fall, the surface tension of the metal has time to pull the drop into a sphere. To protect the metal from oxidation, the atomising gas is usually nitrogen or argon.
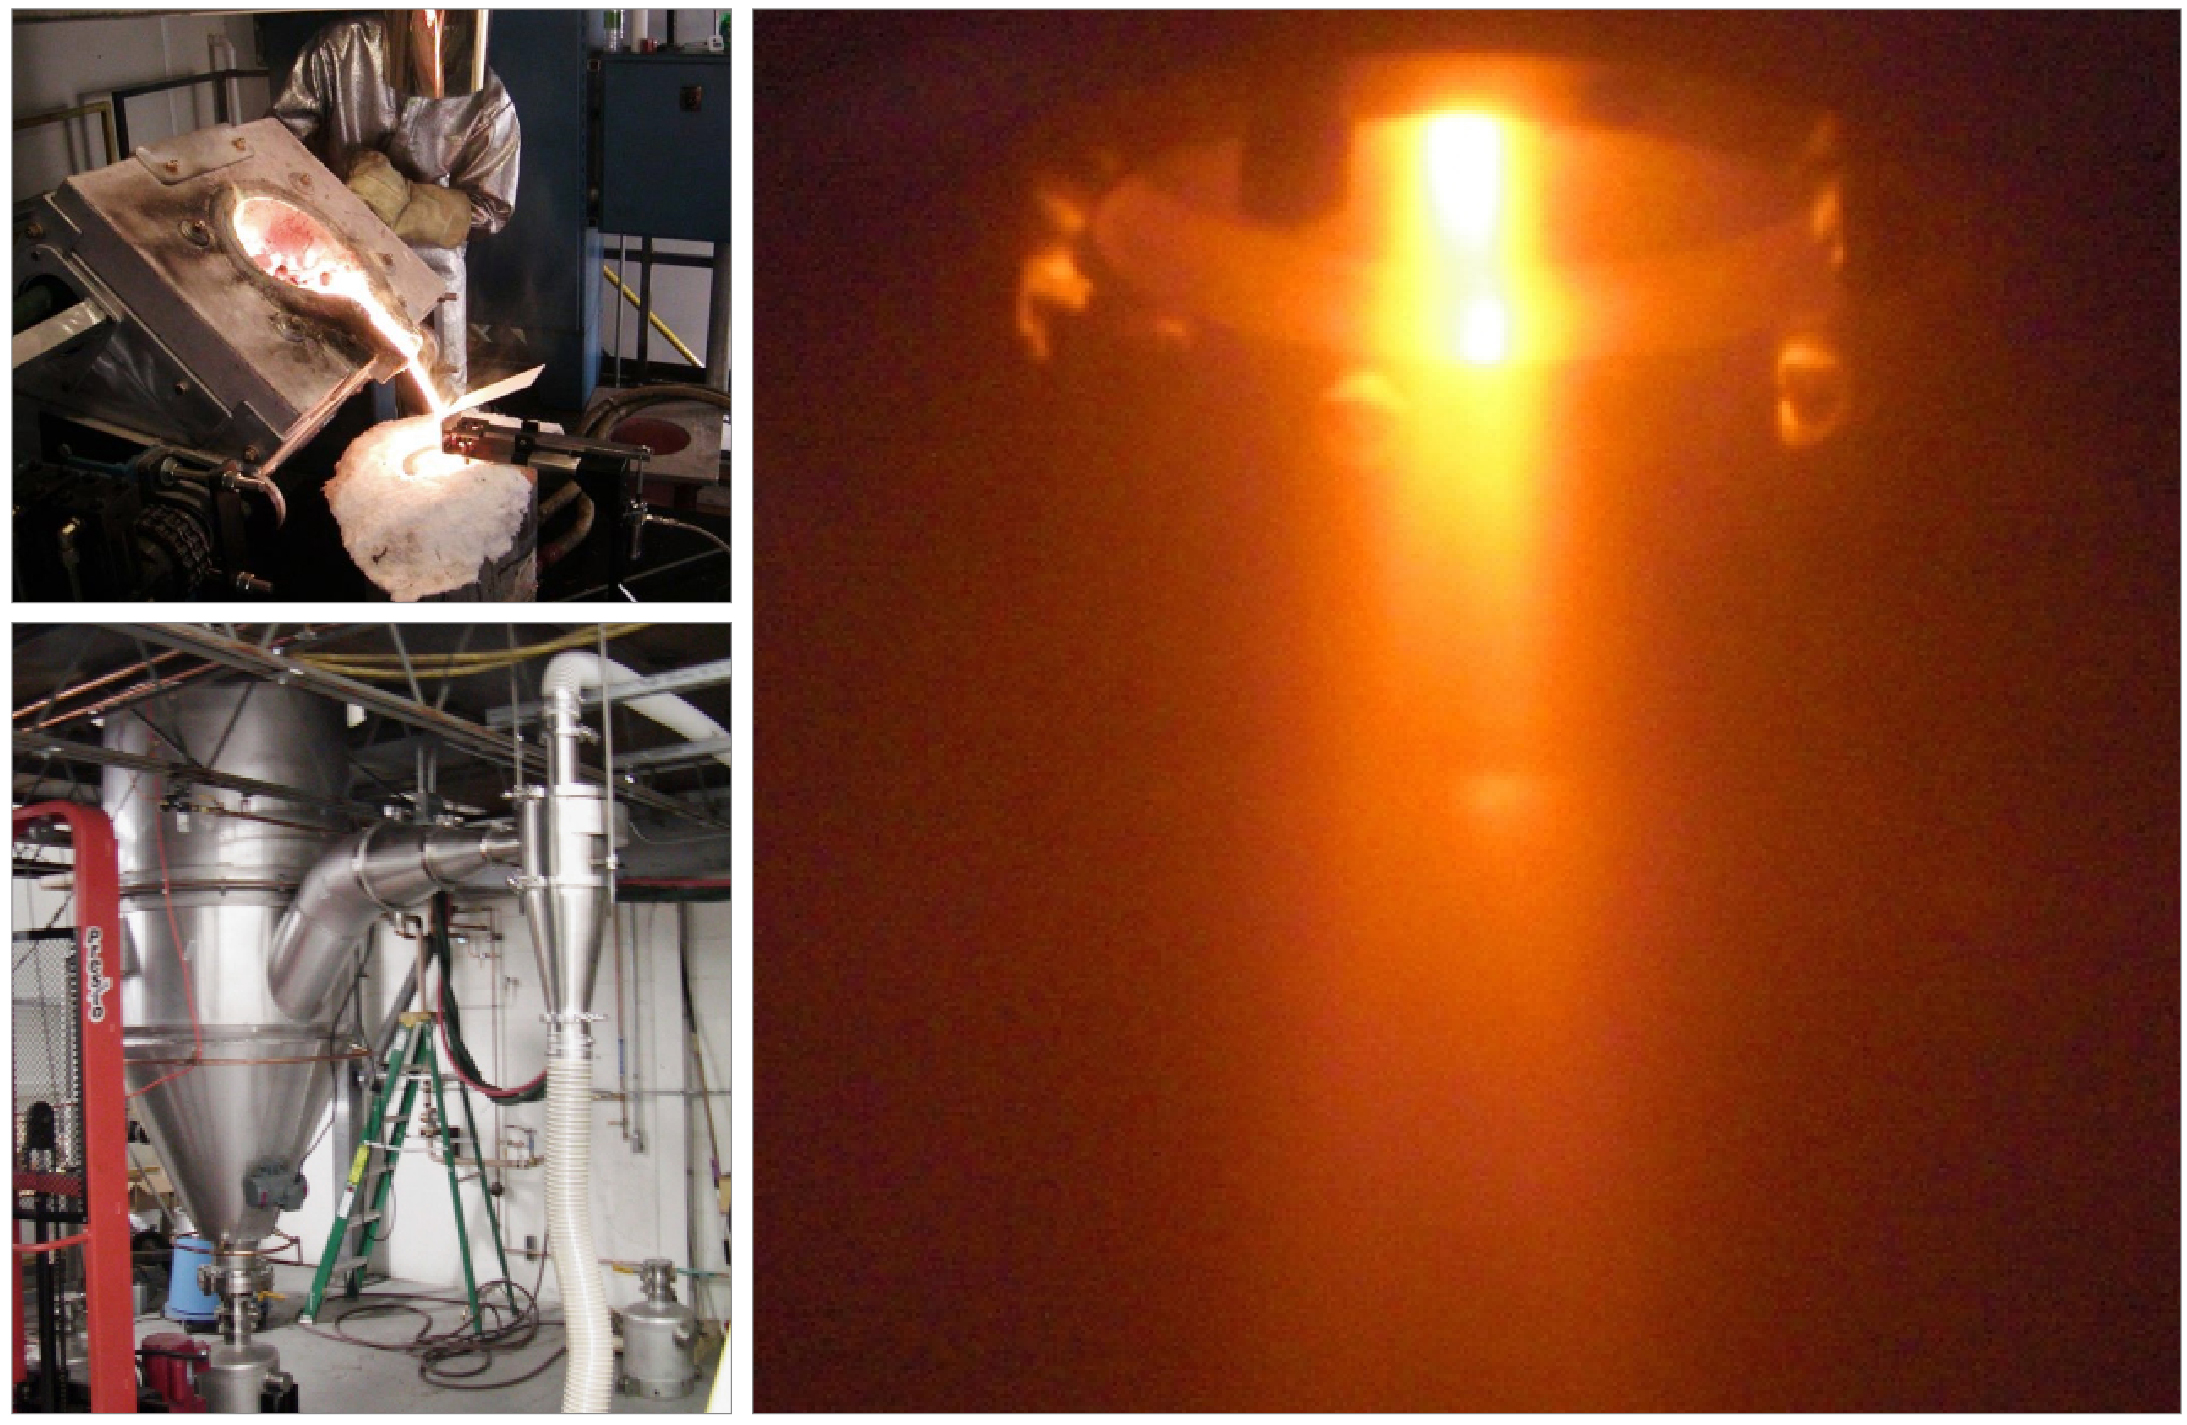
Melting of the starting material, or charge, can be performed in an open atmosphere, under cover gas or in a vacuum (Fig. 2). The melting method and atomising gas have a significant influence on powder cost, with the costliest variant being vacuum melting with argon atomisation.
Gas Atomisation is, in many cases, the best technology for producing high quality powder at a reasonable cost. The alloy is made in the melting furnace from various raw materials, which gives a tremendous flexibility on composition. The powder has very high cleanliness and very good flow rate. Powder size can be controlled by adjusting metal flow rate, gas pressure and flow, and nozzle design. It is worth pointing out that gas atomised powders were used in the early development of many of the AM processes and as such provided a foundation for the technology.
Induction Melted Bar Atomisation
Induction Melted Bar Atomisation, called EIGA by ALD Vacuum Technologies GmbH, is a version of Gas Atomisation. The tip of a bar, typically 50 mm diameter, is heated by an induction coil until a melt stream forms which can be atomised with high pressure gas.
The powder is similar to that produced by standard Gas Atomisation; however, the advantage is that reactive materials such as Ti6Al4V can be melted, since the metal does not make contact with any ceramic crucible or nozzle. One disadvantage is that a high-quality bar stock is needed as the starting material, limiting alloy choice and increasing raw material cost.
Plasma Atomised Wire process
In the Plasma Atomised Wire (PAW) process, plasma torches are used to melt a wire and produce the powder. The droplets are cooled and collected in a manner similar to Gas Atomisation. The PAW process is primarily used for titanium alloys due to the challenges of handling molten titanium in Gas Atomisation.
PAW powders are very clean since the chemistry comes from a solid metal wire and the powder is spherical with excellent flow rate. The main challenges with the PAW process are the high manufacturing costs, due to low production rates, and limited alloy flexibility, as the starting material has to be available as wire.
Plasma Rotating Electrode process
The Plasma Rotating Electrode Process (PREP) process has long been considered the ‘Rolls-Royce’ of metal powder production processes. The powder is manufactured by spinning a bar at high RPMs and melting the end with a plasma torch. The centrifugal force then throws the liquid metal out radially and droplets are formed and solidified. The powder is perfectly spherical and very clean.
PREP is best for coarser powder; however, new plants use higher RPM systems that can decrease the particle size to better suit Additive Manufacturing. This has also reduced costs to within a competitive price range for high quality AM applications.
Water and hybrid atomisation
Water atomisation is the highest volume metal powder production technology. It is used primarily to produce powder for press and sintered Powder Metallurgy automotive parts, as well as being popular in the Metal Injection Mouding (MIM) industry.
In this process, a metal stream is disintegrated with high pressure water. Since the metal is cooled very quickly, the droplets do not have time to spheroidise, resulting in an irregular powder. The smaller fractions of the water atomised powder (below 30 µm) are, however, more spherical and can potentially be used for powder bed processes which can spread finer powder.
There are also gas/water hybrid processes in which the metal stream is ‘pre-atomised’ with gas, then hit with water jets. This makes the powder more spherical while reducing the cost somewhat compared to Gas Atomisation.
How to describe and quantify powders
Powders are usually tested to find the following data; chemistry, Particle Size Distribution (PSD), Apparent Density (AD), Packing Density (PD) and Hall Flow rate. The manufacturer documents the powder with a Test Certificate, or cert, that has the above information listed and the powder specifications issued by users include these measurements.
The question of spherocity
Before considering the above data, the question of powder spherocity is often raised. As an oversimplification, it is said that Additive Manufacturing requires spherical powders. This has led to a series of claims that manufacturer X has the ‘most spherical’ powder, which is therefore best for Additive Manufacturing. So what is the reality on spherocity? It is perhaps better to say that non-spherical powders are unsuitable for AM. A spherical shape improves both flow rate and relative density, both of which are desirable for most AM process.

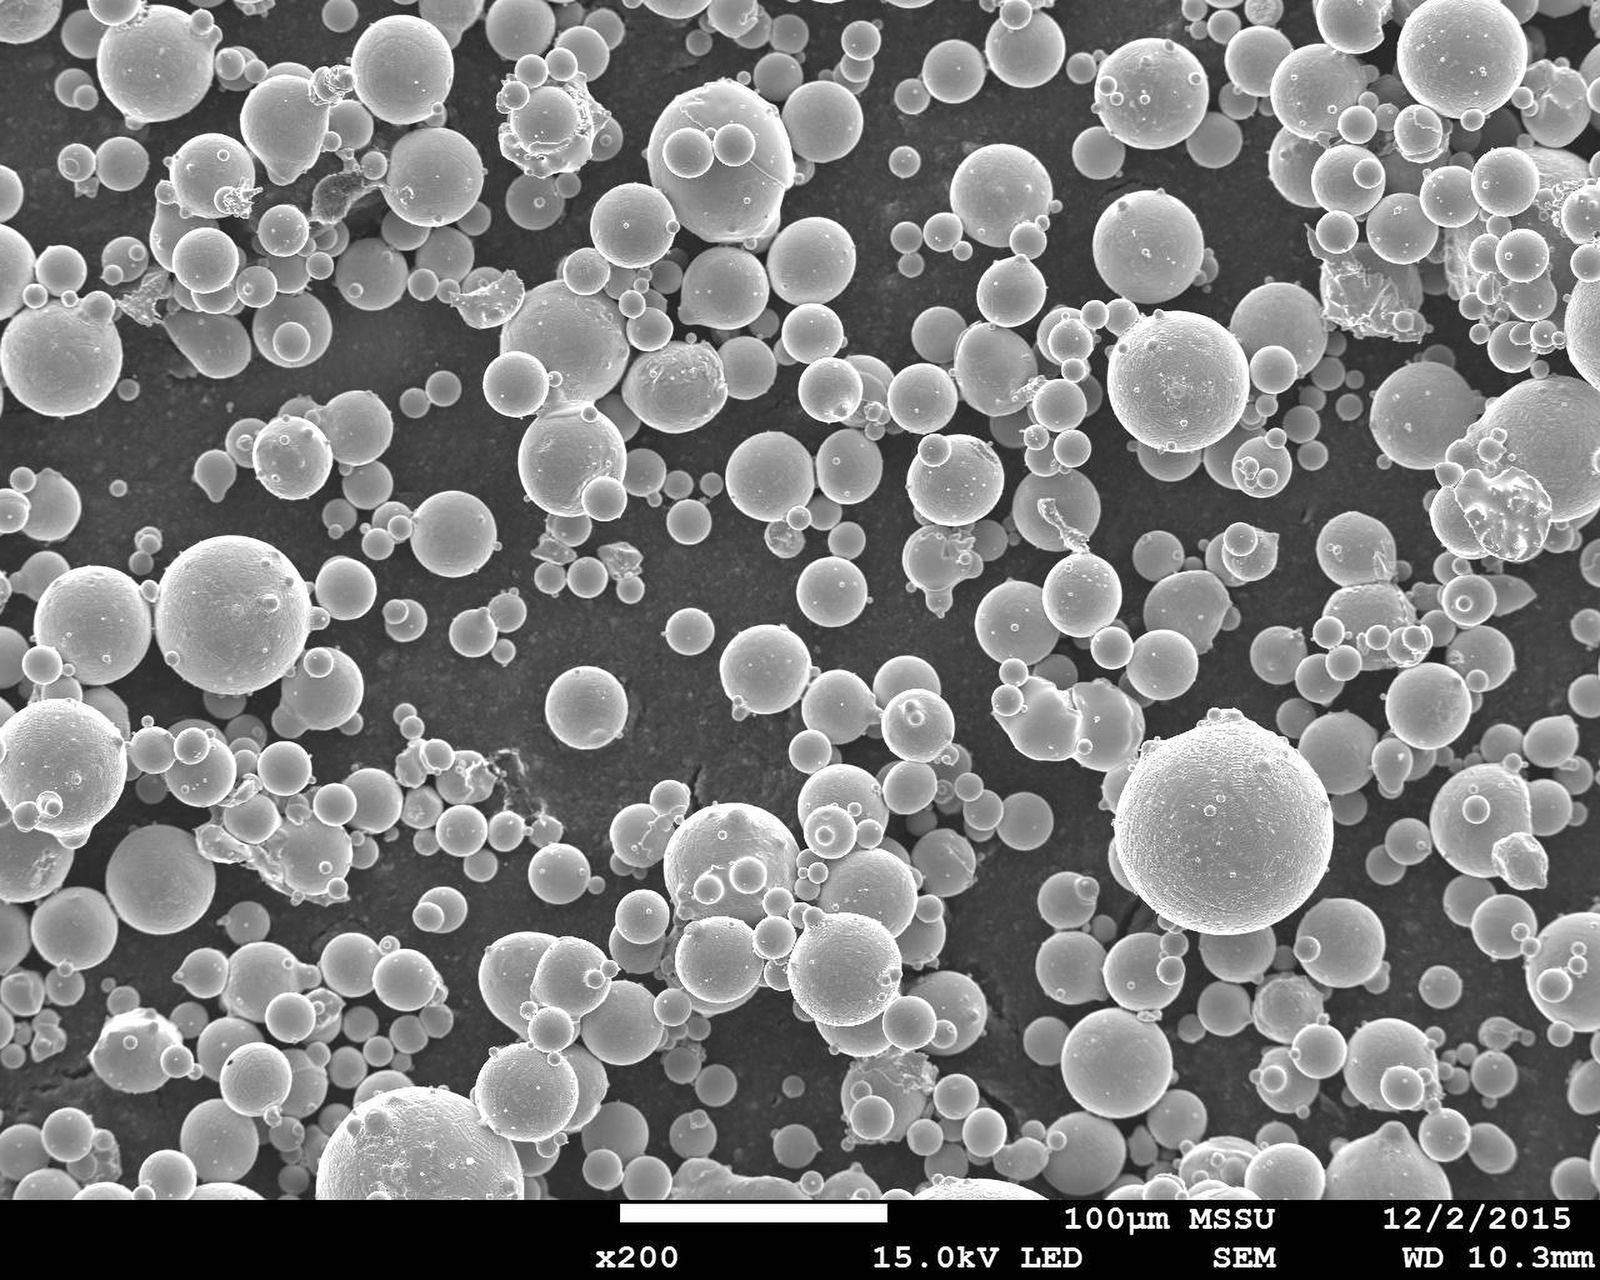
There are no generally accepted methods for measuring powder shape or morphology, even if new technologies make this possible. SEM pictures can be analysed or other photographic techniques can be used.
The spherocity of a powder may be interesting but, in the end, it is rather academic. It is better to directly measure powder properties, such as flow and packing behaviour. It is also preferable to evaluate the dynamic properties of a powder rather than taking static measurements. Instruments from Granutools, Belgium, for example, can give good indications on powder behaviour in various AM systems by measuring powder in motion.
Chemistry
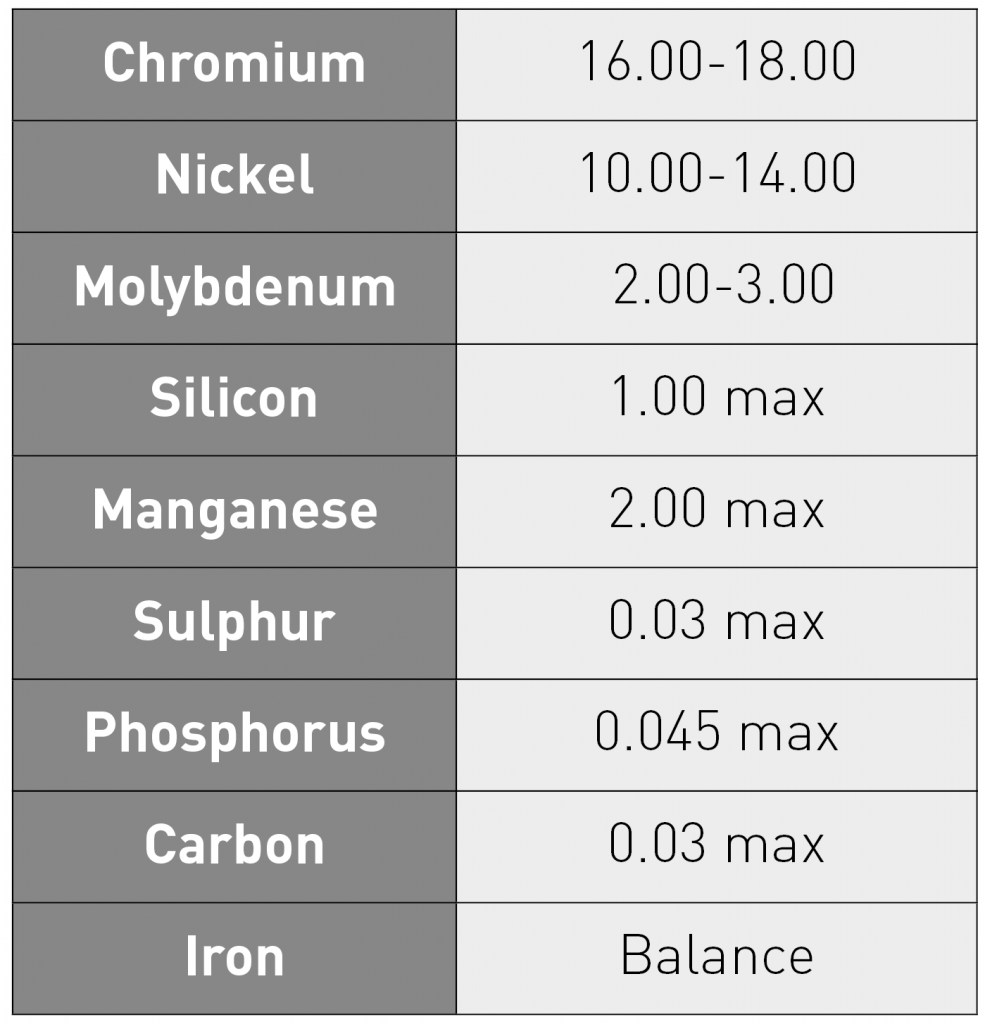
The chemistry of a powder is paramount since it defines the alloy. The analysis is specified with a range for each element. There are major, minor and trace elements for most alloys. For example, 316L stainless steel has Cr, Ni, Mo as major elements, Si and Mn as minor elements, and C, P, S, N and O as trace elements. The balance is Fe.
Major elements determine the alloy properties. It should be noted that elements interact and must be kept in proportion for some alloys. For example, if Cr and Mo are at the upper limits and Ni on the low side in 316L, the alloy will start to have a ferritic phase and become magnetic. Minor elements also impact an alloy’s phases and can have negative effects on weldability and sinterability in Additive Manufacturing.
Trace elements usually only have maximum limits. They can also have a dramatic effect on properties such as crack sensitivity and impact toughness. ‘Balance’ is the term given on some alloys to account for what is left in the analysis. Since 316L is a steel, the balance is Fe. This is a convenient way to allow for variations in chemistry. The balance is used instead of a number, since summing up elements would not yield exactly 100% due to variations in analytical methods (Table 2).
Some alloys are quite complex, such as IN718, a popular high-temperature superalloy in AM. Table 3 lists the chemistry of UNS N07718. In 718’s case the balance is not nickel, as would be expected with a nickel-base superalloy, but iron.
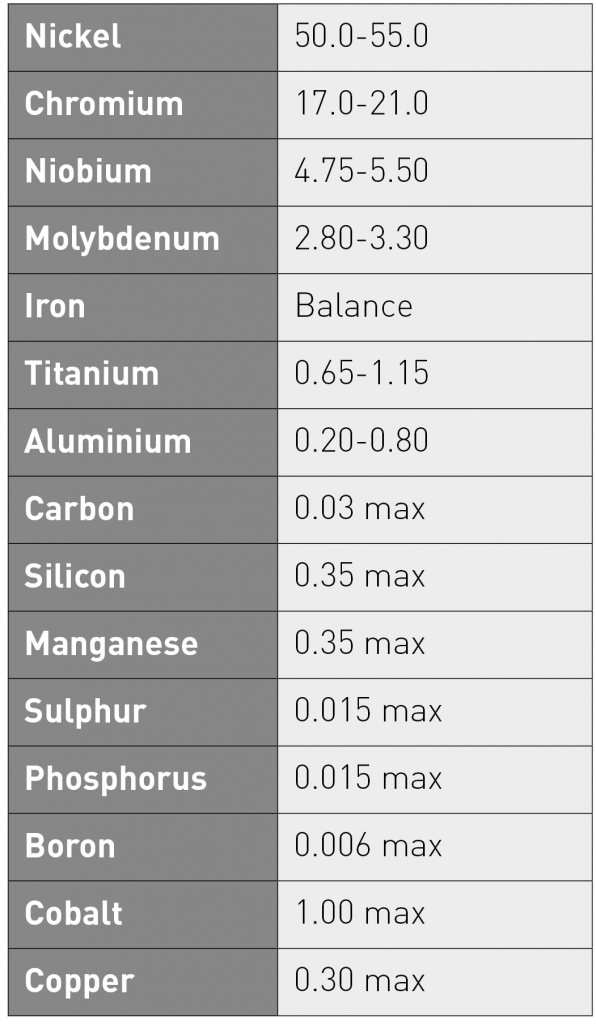
Aluminium and titanium are important elements in 718 as they allow for hardening and phase development in the alloy. They can be affected by the AM process by volatilising or forming oxides or nitrides if the atmosphere is not properly controlled.
Most of the standard alloys used in Additive Manufacturing have ranges established for cast and wrought alloys. These are spelled out in ISO, ASTM and UNS standards. It is worth noting that there are virtually no special powder chemistry specifications for Additive Manufacturing powders – or for other applications that make parts from metal powders. The chemistry refers to the finished part. So, referring to ASTM B348 for a Ti6Al4V Grade 5 powder is incorrect. It is better to use UNS R56400, which gives the chemical analysis for the alloy.
The end-user expects the built part chemistry to conform to an analysis, since this determines alloy properties. Many values can change during processing in AM systems. It is easy to increase oxygen and nitrogen during processing and some elements, such as Cr and Al, are sensitive to burn-off.
The problem with powder versus part chemistry is well known in MIM, a process which is technically close to binder jetting. Part manufacturers generally report the powder chemistry since it is impossible to do a chemistry test on individual parts and difficult to even test batches. The analysis may even differ on a single part, depending on wall thickness and furnace orientation.
For Additive Manufacturing parts, it is possible to include a few test pieces in a build for chemical and mechanical testing. With long build cycles for laser and electron beam-based powder bed processes, this is a good option for chemistry and will not add much to part cost.
Internal powder specifications from part producers often have tighter ranges and maximum limits than UNS/ISO to compensate for what happens in AM machines during build-up or sintering. Obviously, weldability is a concern for laser and electron beam processes, while sinterability is key for binder jetting and other MIM-like processes.
Particle Size Distribution
All AM metal powders are specified with a Particle Size Distribution (PSD). The PSD is usually described in percentiles: D10, D50 and D90. D10 indicates that 10% of powder by weight is finer than this micron size. The D90 size indicates that 10% of the powder by weight is coarser than the micron size. The D50 shows the middle of the distribution. Fig. 4 shows a 15-45 µm PSD based on volume of powder particles– which translates directly to weight. The data are from laser diffraction analysis.
In most cases, the powder manufacturer or equipment OEM only gives the D10, D50 and D90 on the test certificate. On request, it is possible to get the complete PSD from the manufacturer, or you can send a powder sample directly to an independent laboratory for analysis. Fig. 5 shows the chart that usually accompanies a full PSD report.
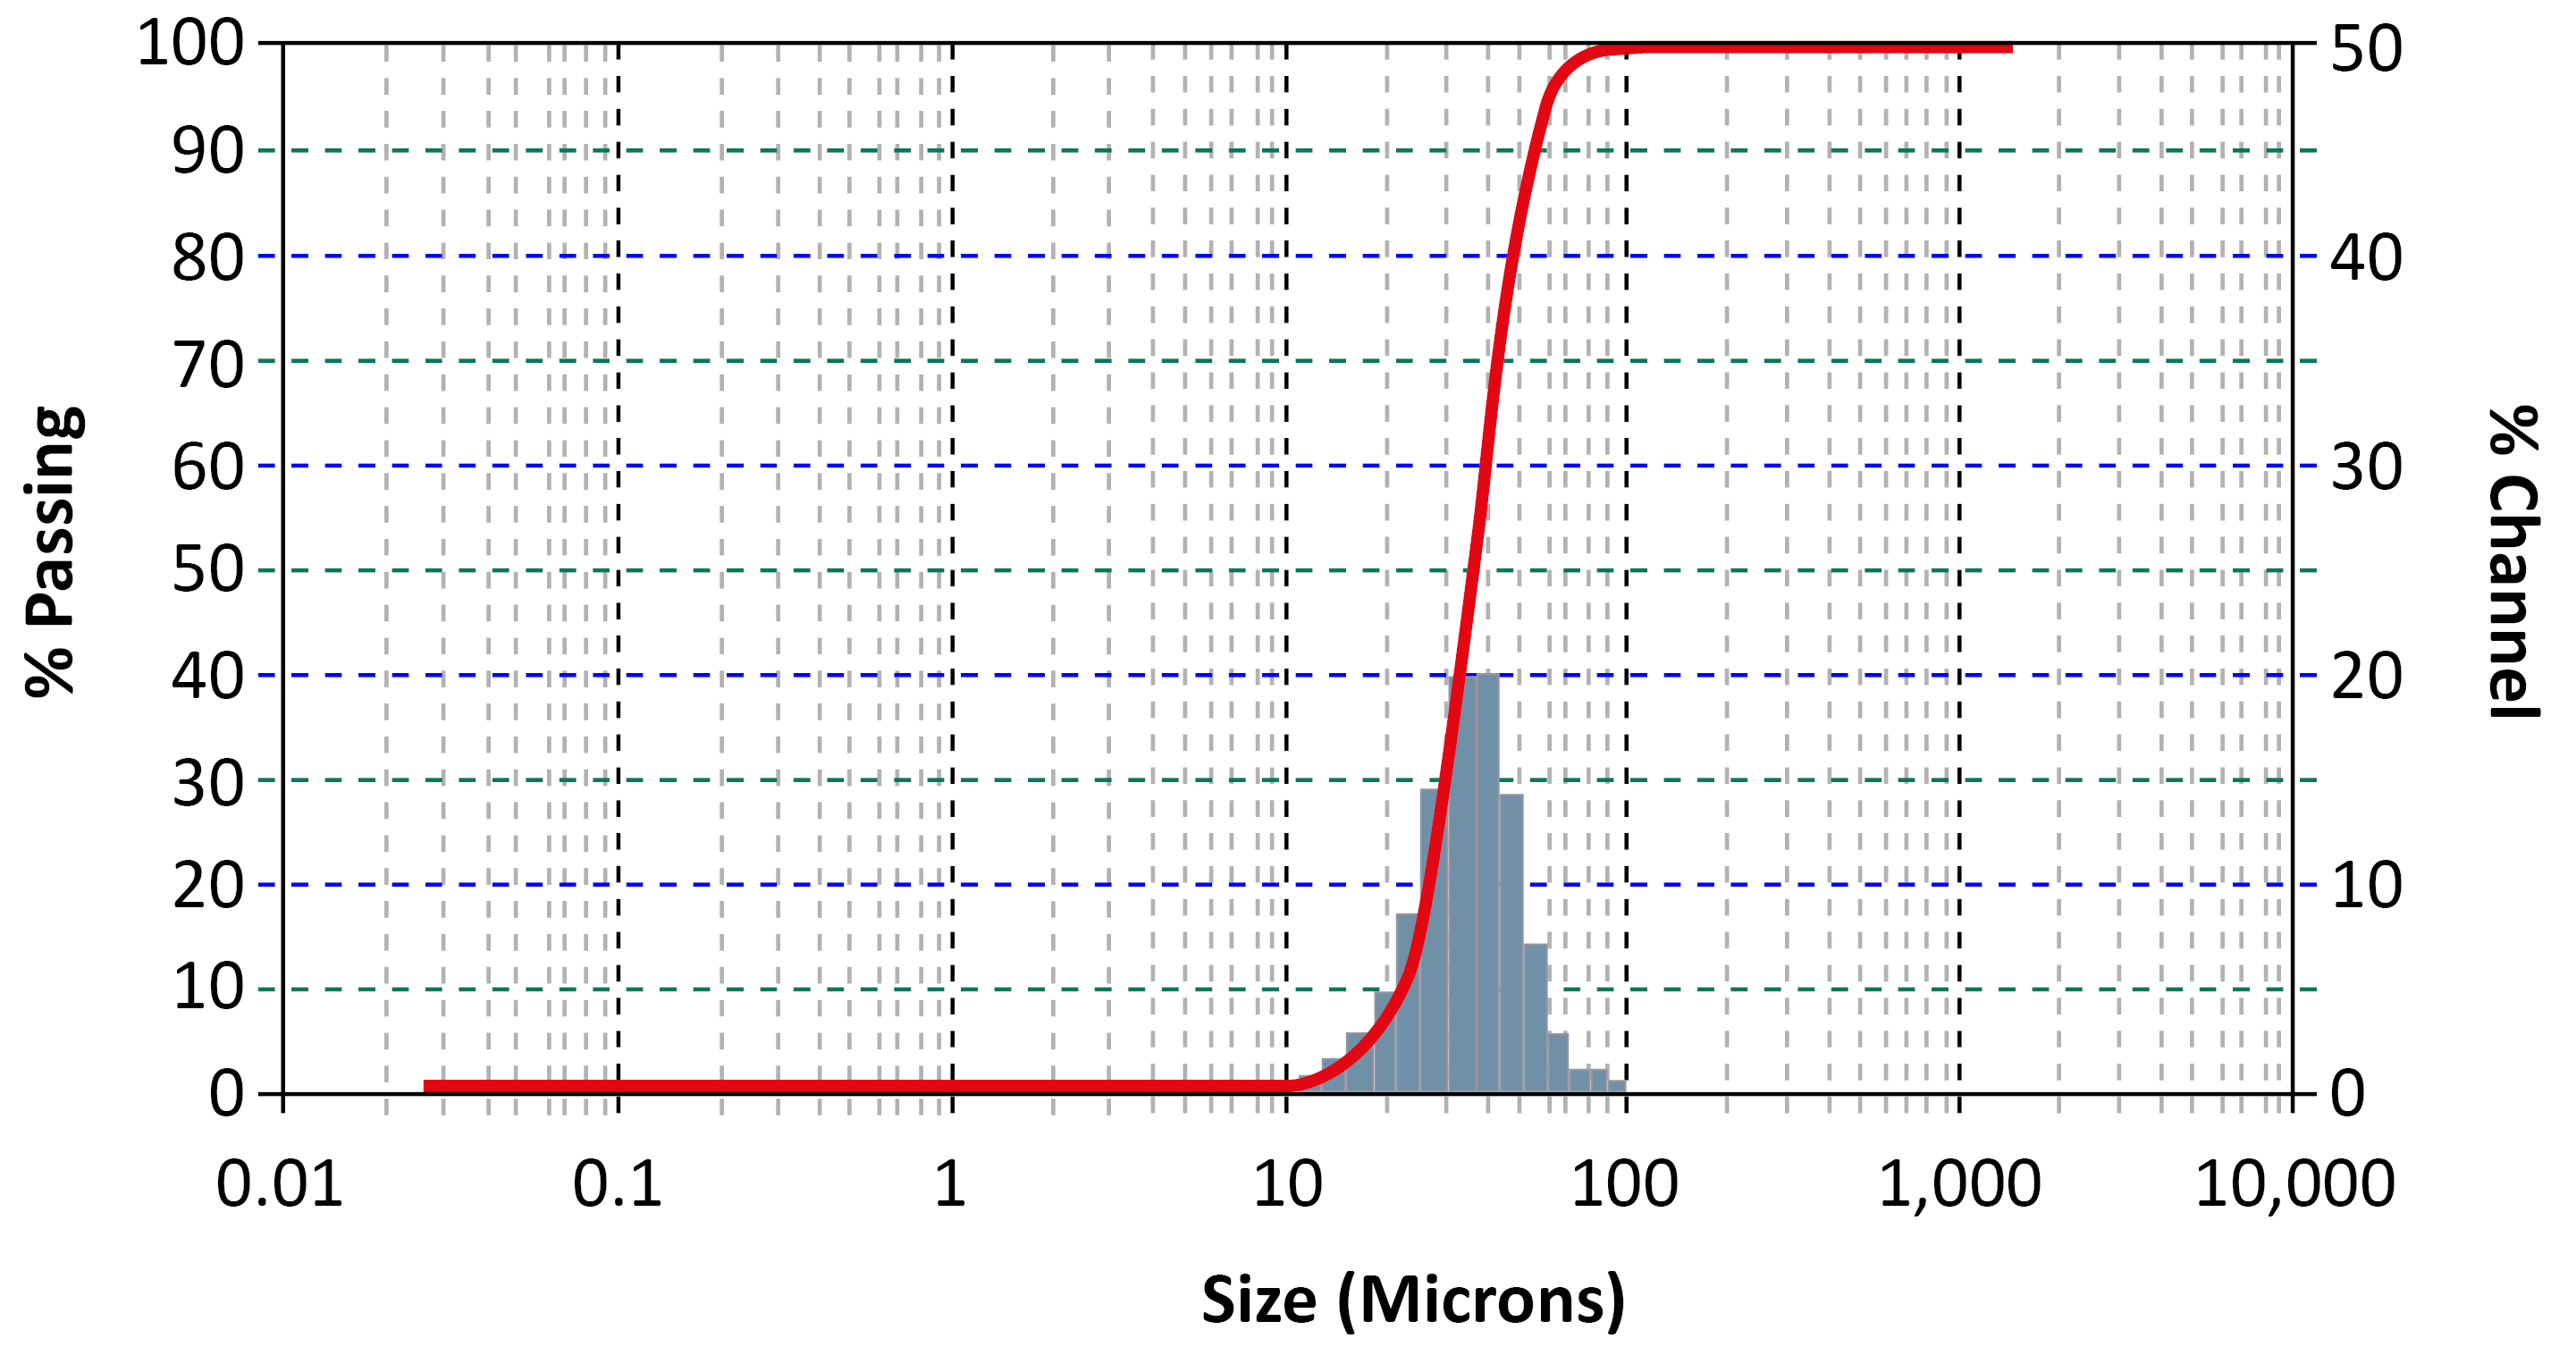
Figs. 5 and 6 show the same powder as Fig. 4. Fig. 5 is from the instrument manufacturer’s software and uses a log scale, which is common for scientific data. However, it effectively hides any useful information when it comes to AM powders. This makes it necessary to re-plot the data to reveal important information. In Fig. 4, the cumulative curve is accurate. The interval data are the same as in Fig. 6, but are misleading in that no correction has been made for interval width. Fig. 6 has been drawn to show the area under the curve to be 100%.
PSD analysis for AM
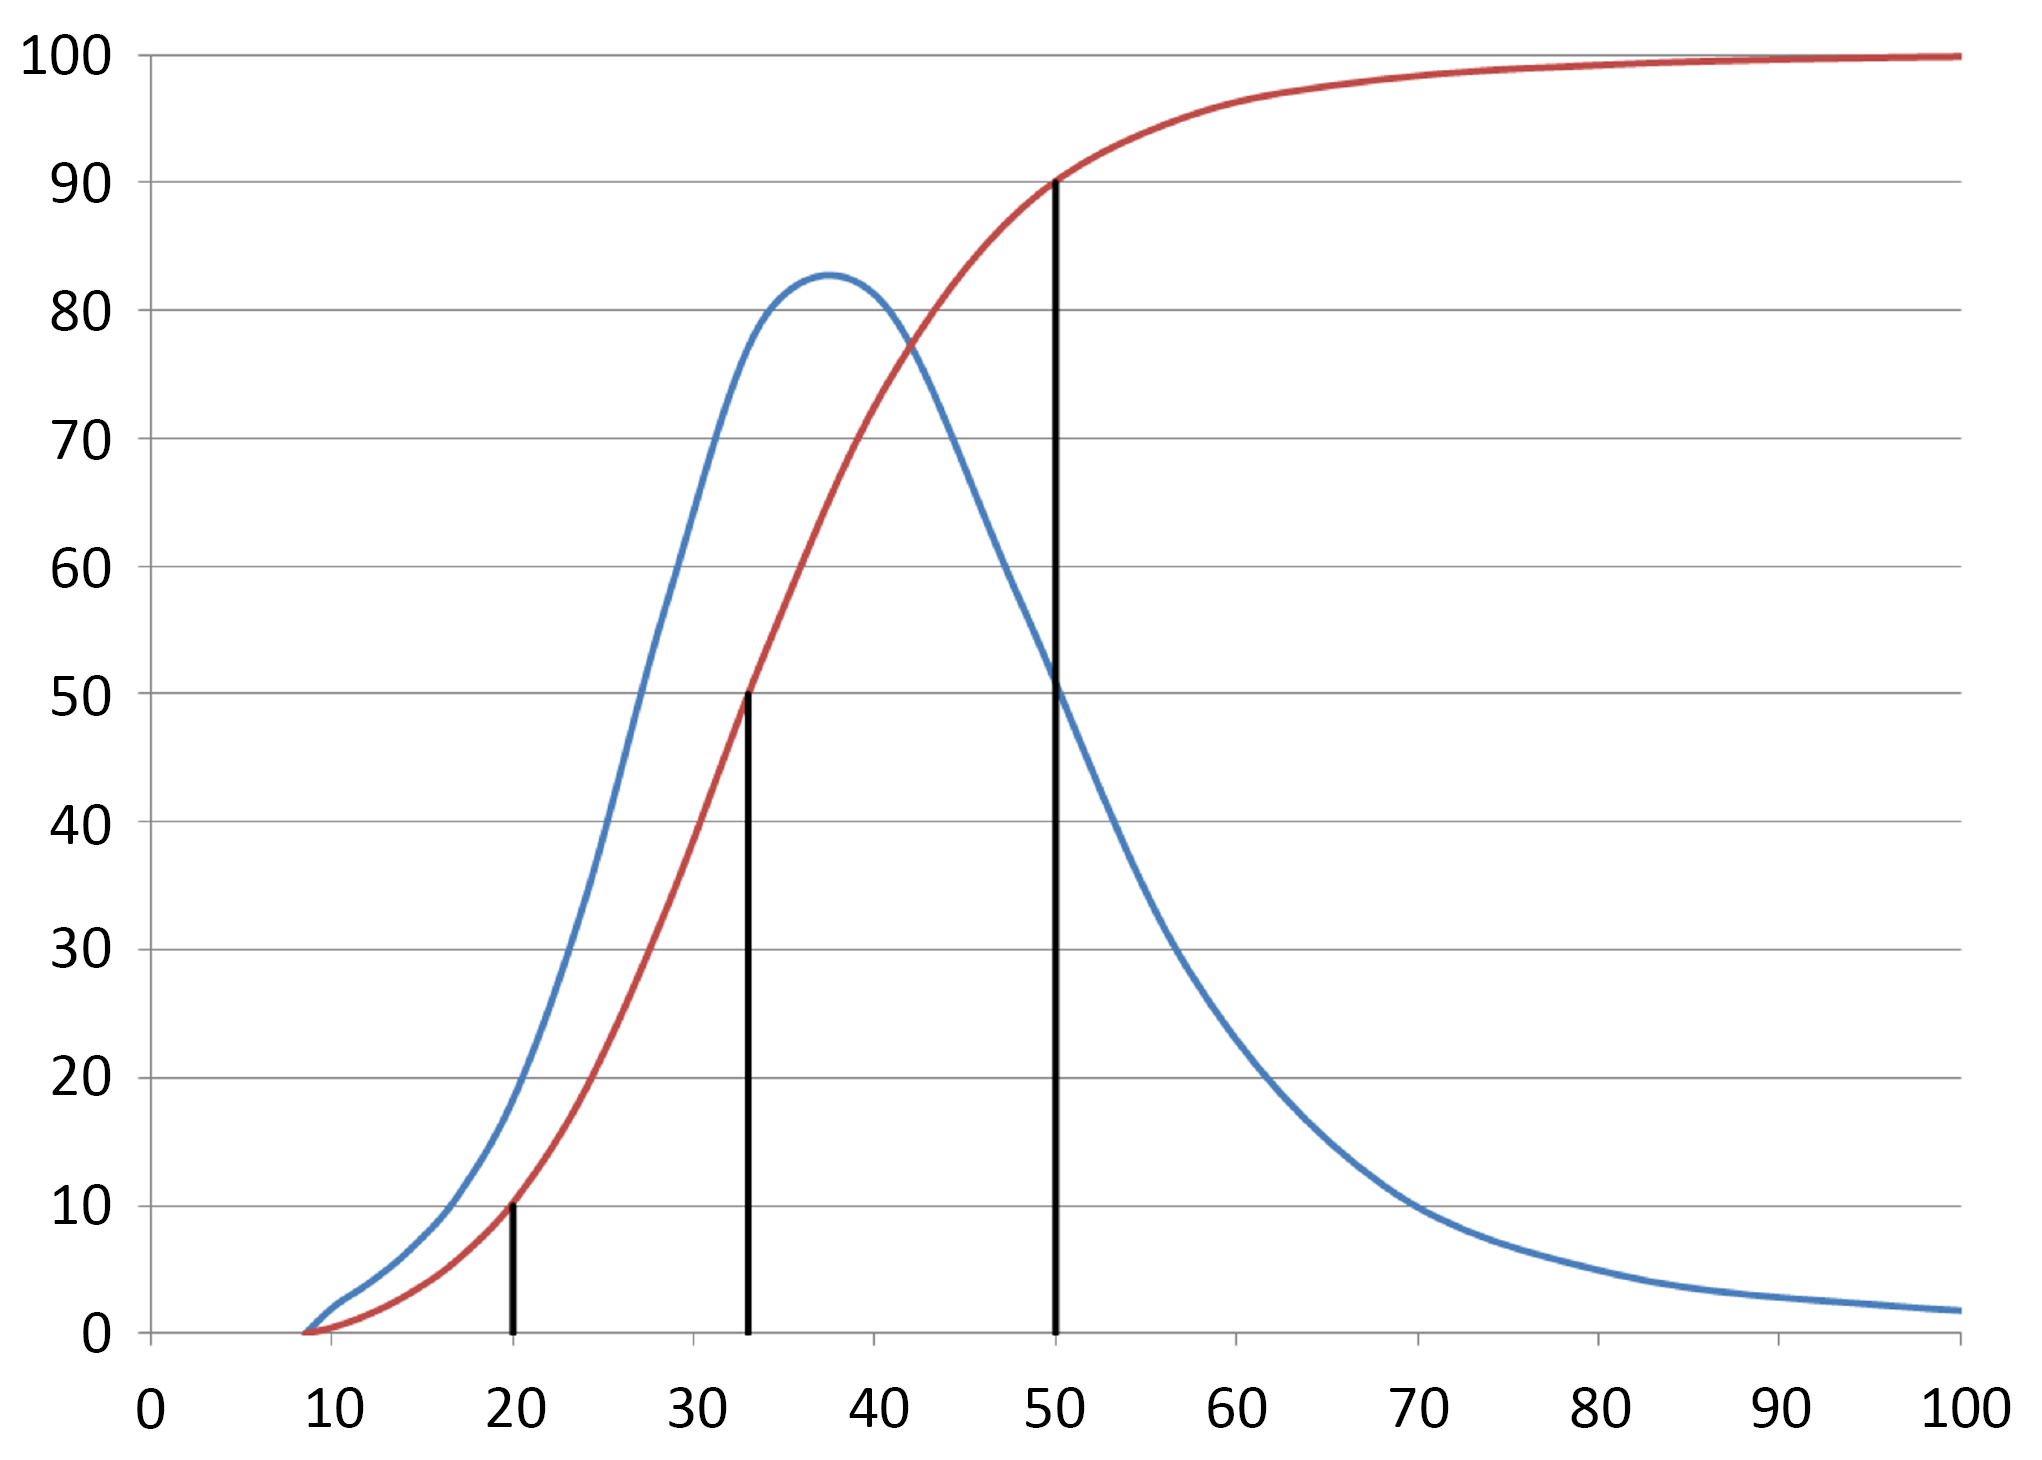
There are several ways to look at Particle Size Distribution, as shown in Fig. 6. The most common is volume, which is the same as weight distribution. Microtrac and other laser diffraction instruments measure the diameter of the particles, as well as counting the number of them, in order to get the distribution. After some mathematics this gives a volume distribution, or surface area.
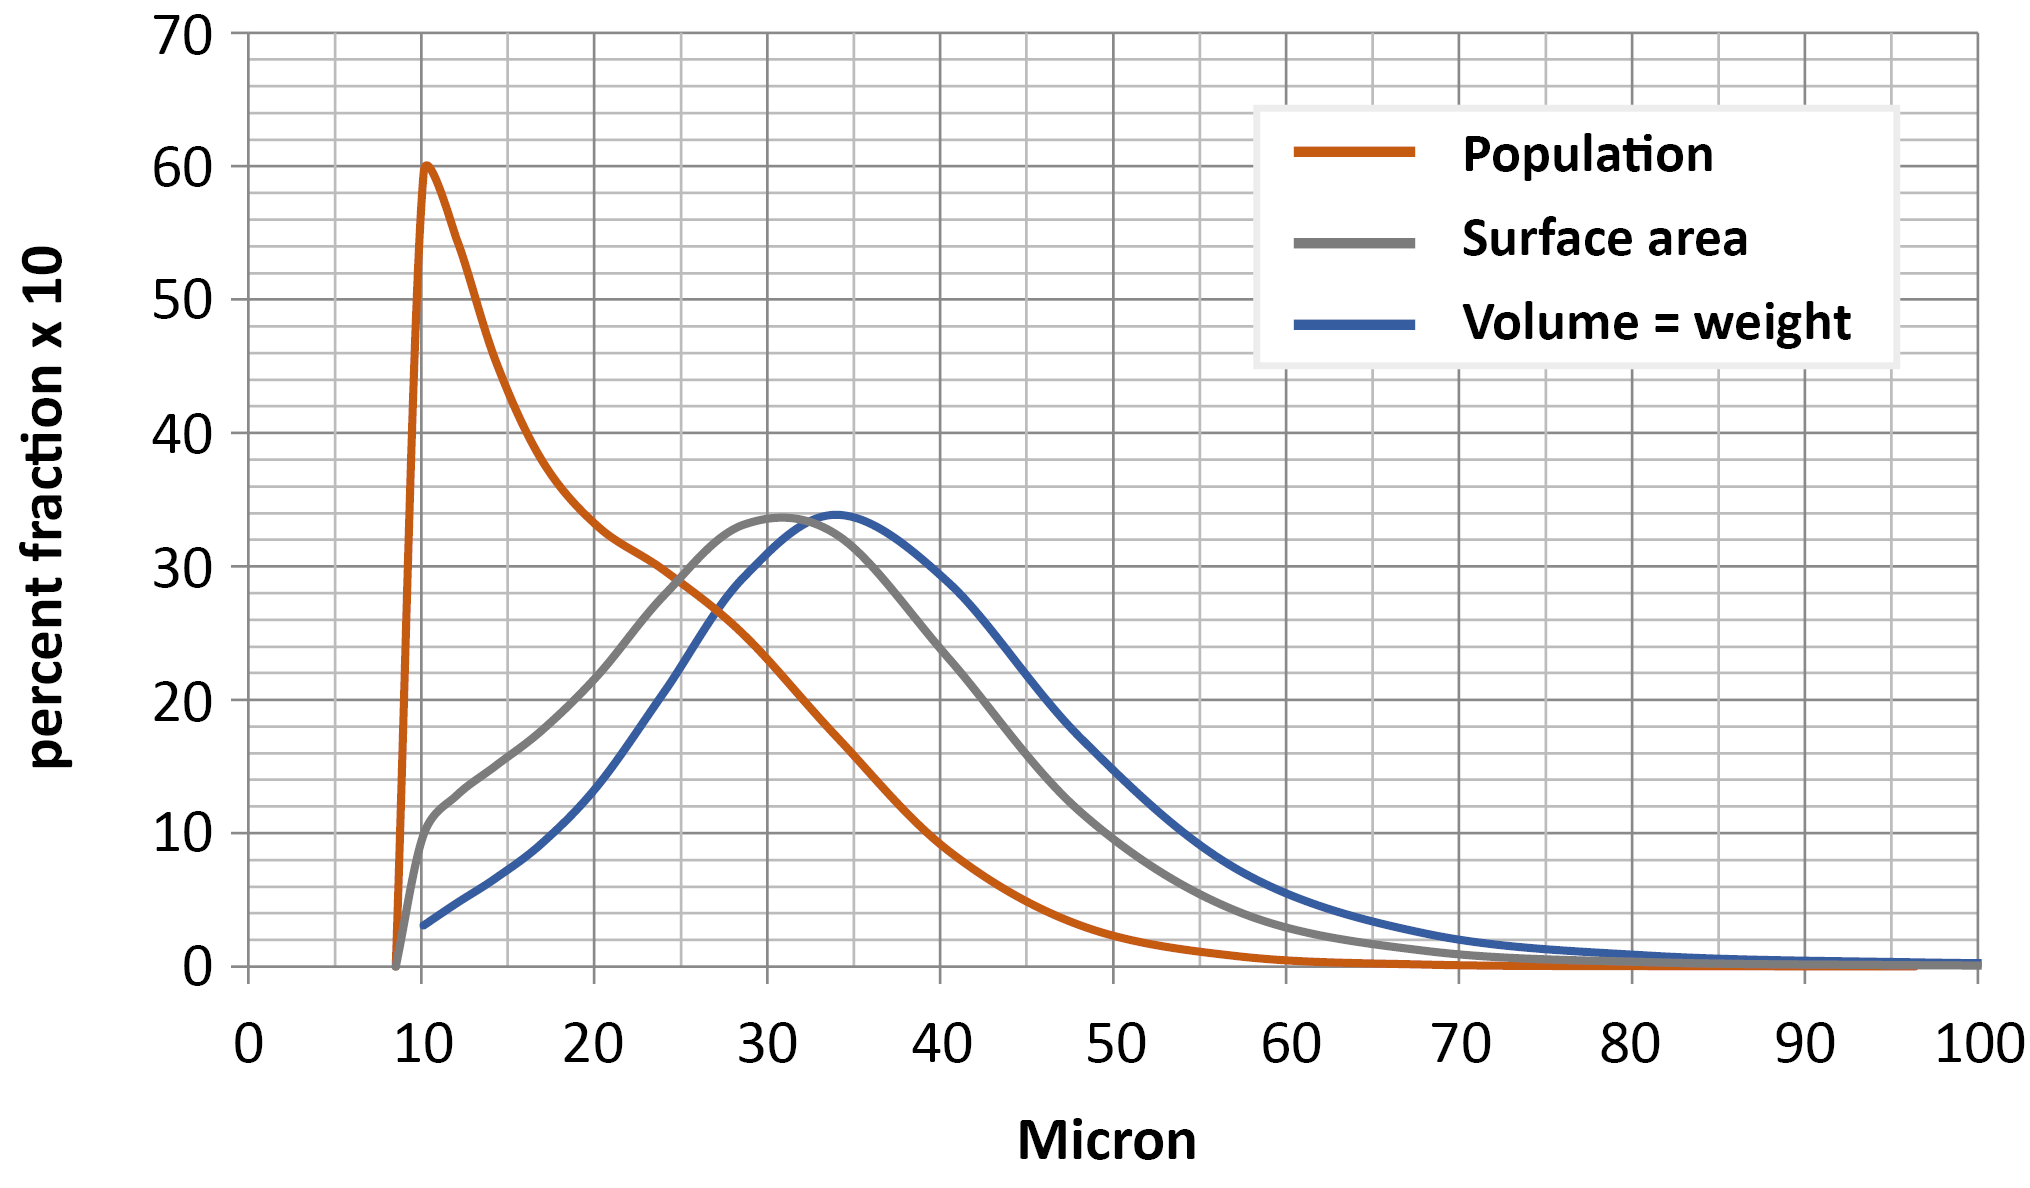
Population
The basis for understanding a powder is to study the particle count, also called population. Whilst it is obvious that a powder consists of a large number of individual particles, it is not necessarily obvious that 1 kg of the 15-45 µm powder in Fig. 4 has over 50 million particles! This is worth keeping in mind when looking at SEM pictures of powder. Only a tiny fraction of the powder is examined and any conclusions drawn can easily be incorrect for the bulk volume.
The population curve is dramatically different to the volume curve, since the latter is based on the r3. The vast number of particles is on the finer end of the distribution. The volume curve effectively hides the fines and makes it difficult to see any variations.
The fine particles can have a significant effect on the Additive Manufacturing process. They melt quickly in Laser Powder Bed Fusion, which is helpful, but can evaporate, creating smoke or porosity. The flow characteristics are also affected, as a small amount of fines can act as ball bearings, improving flow, while large amounts of fines tend to increase particle cohesion, resulting in a lower flow rate.
From a particle population standpoint, there is a big difference between 15-45 µm and 22-53 µm. Binder based MIM-like processes rely on sintering for densification. The higher the surface area, the better the material will sinter (higher density, less slumping, lower sintering temperature required, etc). In this case, the surface area curve can give information helpful for processing.
PSD specifications
The PSD specification is important for both the powder producer and the end user, providing a direct control of the delivered material. A 15-45 µm powder specification could be:
- D10: >15 µm
- D50: 30–35 µm
- D90: <45 µm
There are problems with a specification like this, as it leaves the top and bottom tails open. Better would be:
- D10: 15-18 µm
- D50: 30-35 µm
- D90: 38-45 µm
- -10 µm: 1% max
- +53 µm: 1% max
Powder size is either measured physically with screens (RoTap) or with laser diffraction instruments (Microtrac, Malvern or others). Screens are very good for sizes 45 µm and over. 45 µm corresponds to 325 mesh, so -45 µm is -325 mesh.
Laser instruments are most effective on sizes below 45 µm down to a few microns. PSDs larger than 45 µm should not be analysed with laser instruments. The problem is that the RoTap measurements do not perfectly match the laser value for the same µm size. The laser usually shows a larger + percentage. Since the screens physically measure the powder they are always ‘right’ and should be used whenever possible. The RoTap is more reliable for the coarser end of the distribution, so many specifications use mesh screening for 45 µm, 53 µm and coarser sizes.
Since Electron Beam Melting (EBM) uses 45-105 µm and Direct Energy Deposition (DED) uses 45-180 µm powder (-140/+325 mesh) the distribution can be completely specified with screens.
Apparent and Packing Density
Apparent Density is usually measured by collecting powder under a Hall Flow meter in a 25 ml cup, weighing and the calculating g/ cm3. In other words, this is a very loosely packed powder. AD is a critical measurement for press and sinter Powder Metallurgy, where powder is filled in a cavity under gravity and then compacted mechanically.
Packing Density is measured with a machine that ‘taps’ a graduated cylinder for a fixed number of times to rearrange the powder and decrease the volume to a minimum value. This is then referred to as the ‘Tap Density’ or ‘Packing Density’. The Tap Density is a critical value in Metal Injection Moulding, where it determines the maximum loading of metal powder in the organic binder.
The density of the powder in a powder bed AM machine falls somewhere between the Apparent Density and the Packing Density. This will depend on the design of the feeder and spreader in the machine. Most machines use a doctor blade for spreading and levelling the powder, but some use a roller to pack the powder down tighter.
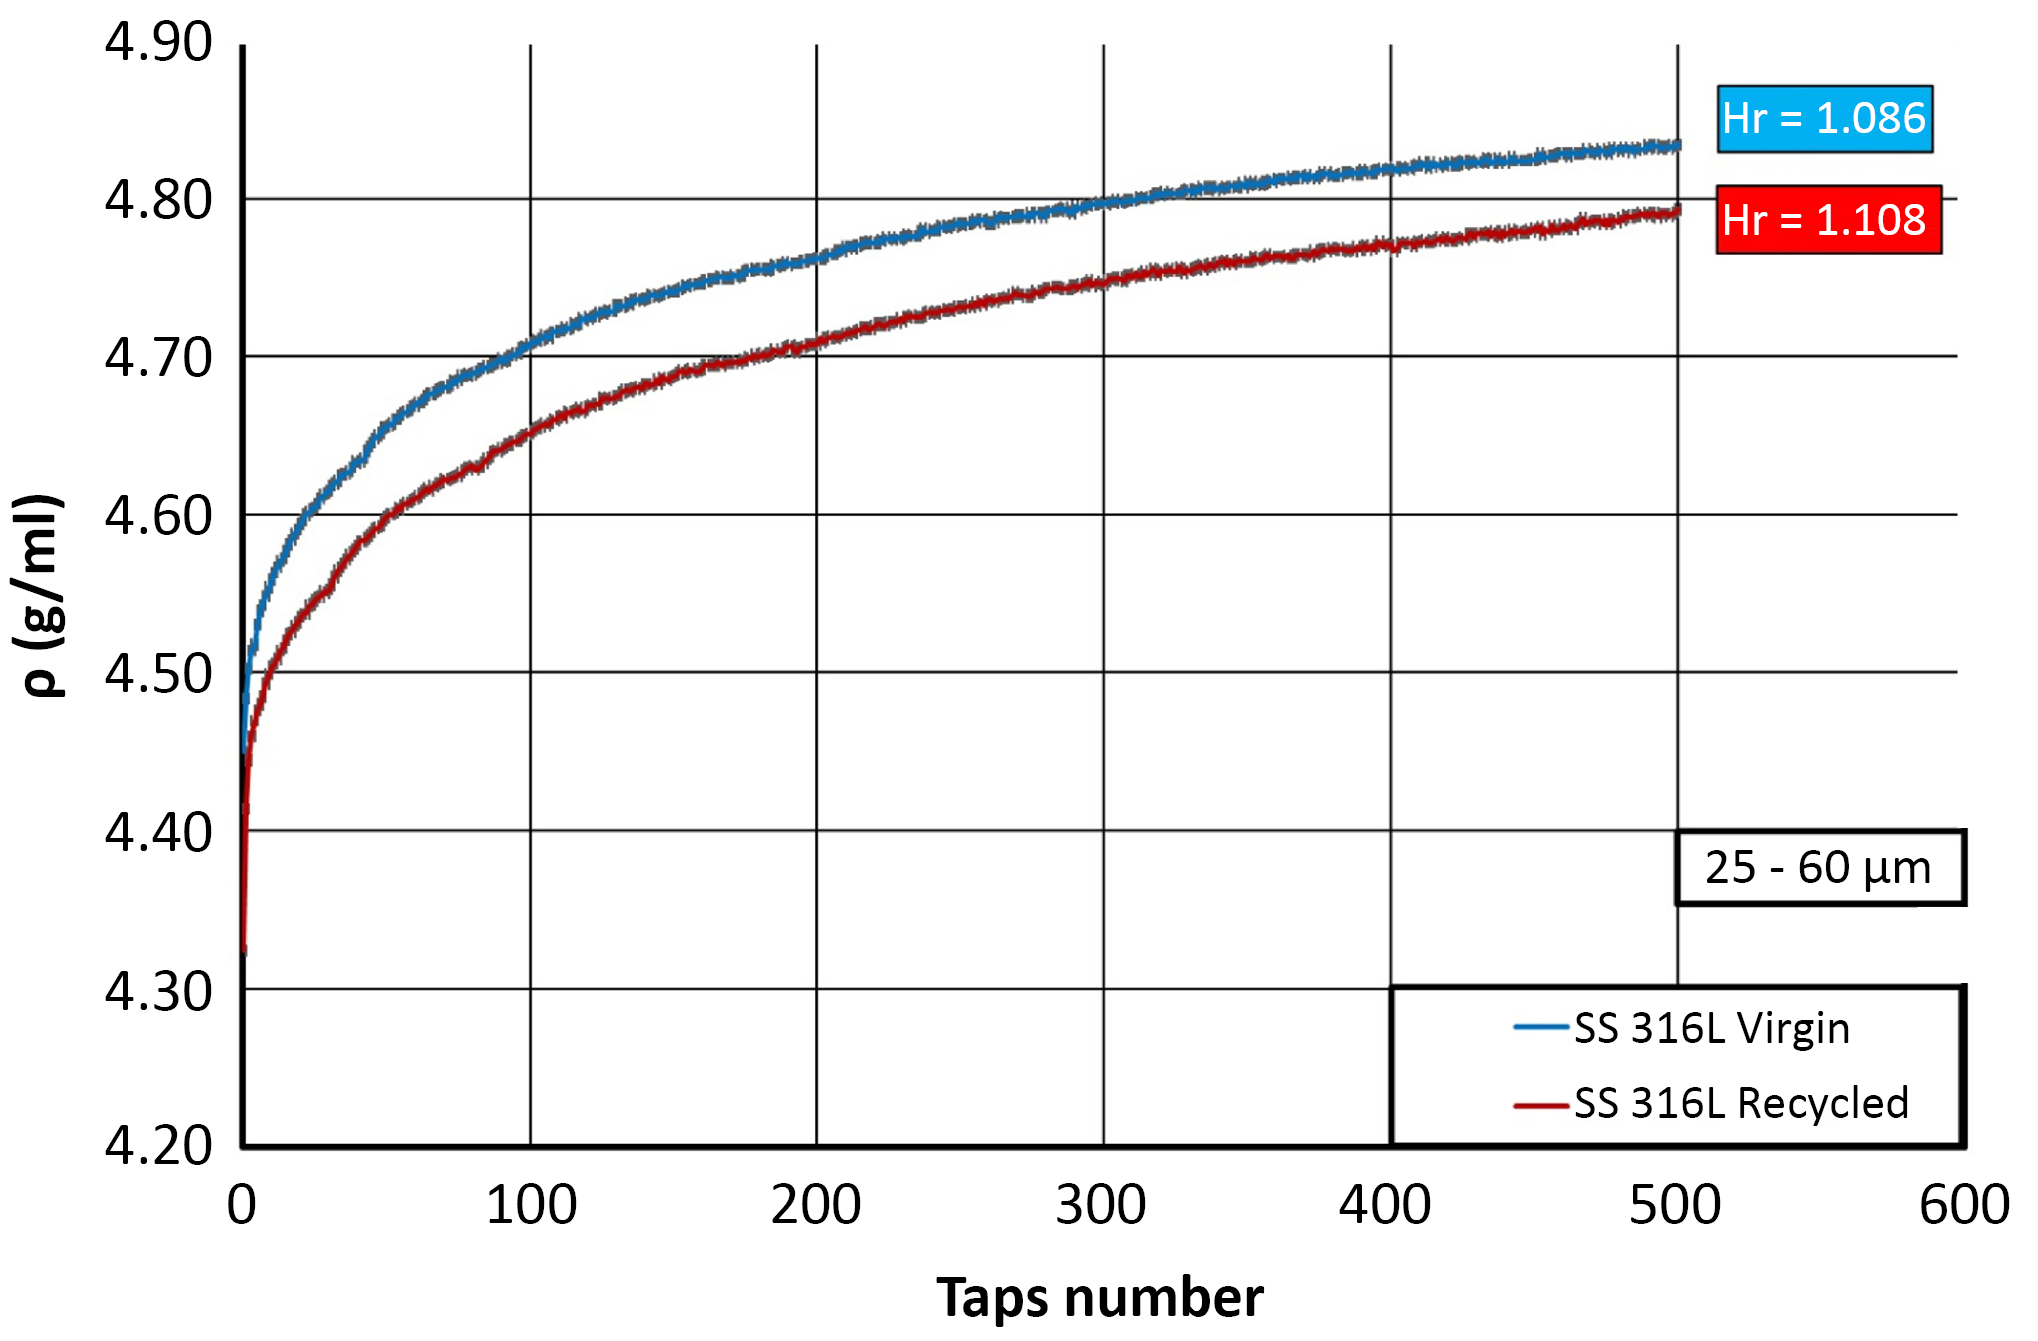
Fig. 7 shows how density increases during ‘tapping’ measured with a Granupack instrument from Granutools. The curve makes it possible to estimate the powder bed density. It is also possible to see lot-to-lot differences, packing behaviour variation between powder suppliers and changes in recycled powders compared to virgin materials.
The relationship between Tap Density and AD is called the Hausner Ratio (H). A lower value of H (closer to 1.0) is desirable for AM powder bed equipment. If AD and Tap Density are close there is less room for variability in the powder in the build volume.
Hall Flow Rate
The Hall Flow meter is an extremely simple instrument with a long history dating back to mechanical stopwatch days. The time to flow 50 g of powder through a 2.5 mm orifice is measured manually in a funnel shaped device. Some Additive Manufacturing machine manufacturers use a 4 mm orifice instead of 2.5 mm.
Perhaps the best attribute of the Hall Flow measurement is its extensive use and historical database. On the other hand, it is subject to operator variability and has limited ‘resolution’. The latter is needed to check if a powder lot has deteriorated after use and needs to be adjusted before charging back in the AM machine.
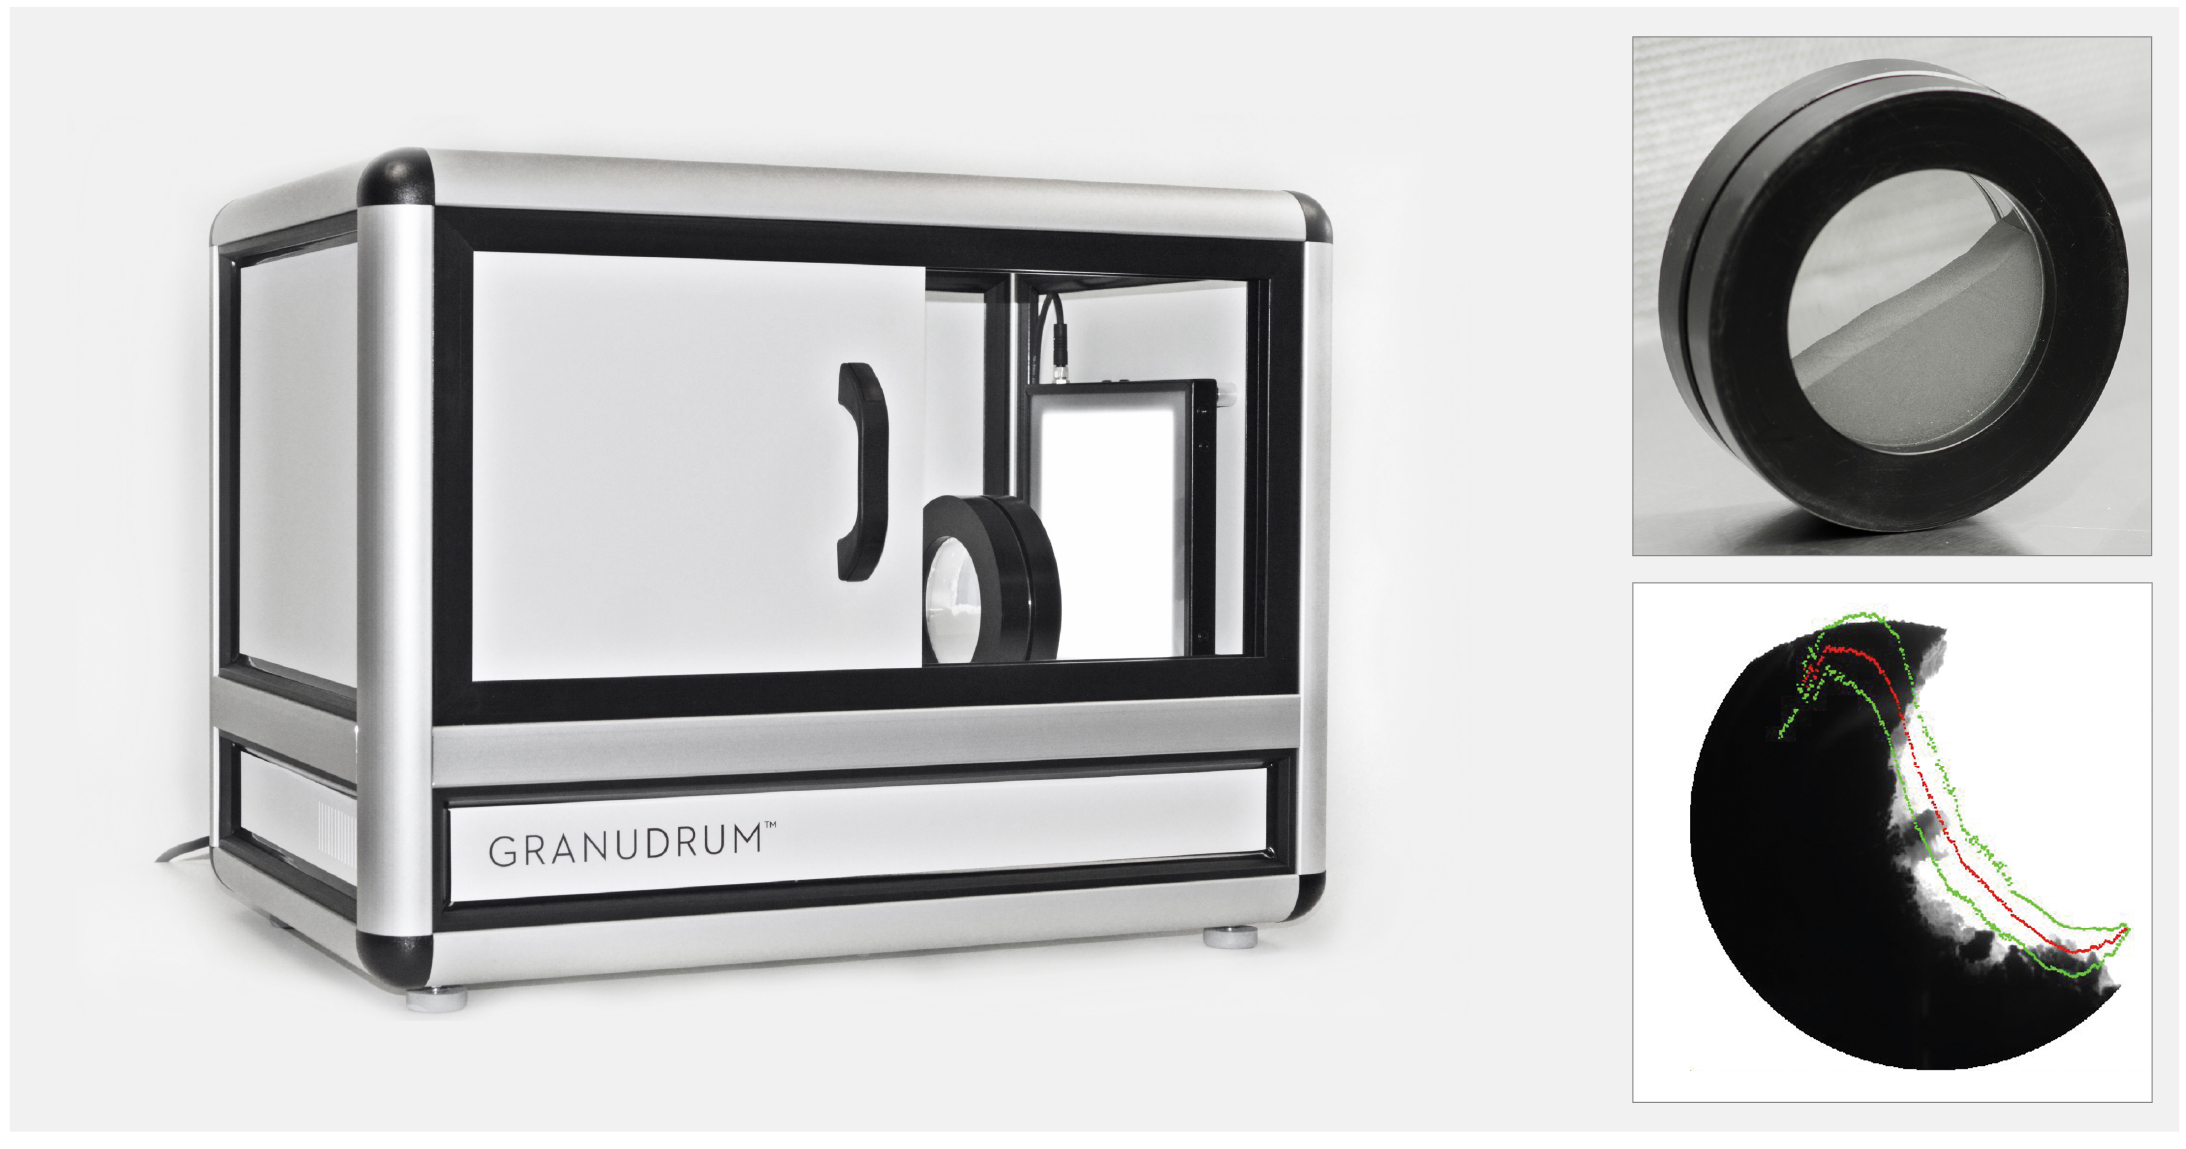
Fortunately, there are instruments that are based on 21st century technology. Fig. 8 shows the Granudrum instrument, which measures how powder flow properties change with velocity. It has an open/unrestricted flow that correlates well with AM powder bed processes, and the information generated is vastly superior to Hall Flow when evaluating and engineering Additive Manufacturing powders.
Heats, lots, batches and blending
There is sometimes confusion around how a powder is specified on the test certificate and the origin of each batch of material. Bulk metals such as bar and plate have a ‘heat number’ which refers to the chemistry of the material. Wrought material originates in large melts, up to 100 tons for carbon steel, while stainless steel and nickel alloys are made in 25-50 ton melts. This is a substantial quantity of material and it is easy to assign a heat number that identifies the material through downstream processing and to the final customer.
Melts made in powder facilities are also assigned heat numbers. The largest metal powder plants can make melts of 5–6 tons in one cycle. Most high-volume production plants have 500–1000 kg furnaces.
Powder yields
The yield of finished material has an effect on how a batch is handled. For the Hot Isostatic Pressing (HIP) of billets, virtually 100% of the powder produced is used and several bars can be made with the same heat number from a 5 ton melt. The same goes for Plasma Transferred Arc and Laser Weld Overlay, where yields are high and it is easy to keep track of a heat.
Most AM powder is made on smaller plants with 250 kg or smaller melting furnaces. The yield here can be low; 30–40% is common but it is sometimes even lower depending on the desired powder fraction.
There is, however, growing demand from AM machine users to receive large heats. This is driven by powder lot qualification. During the development of critical applications in particular, a powder is used to make test bars and to verify machine parameters. When this is done, all powder from the lot is considered qualified. Large lots, therefore, mean less testing and a more efficient operation. On the negative side, a larger inventory is required.
Blending
Nearly all AM powder sold today is produced by blending material from several heats. It may still have a ‘heat number’, but it is really a lot number. Blending is done in small or large blenders, from 250 kg up to several tons. Blending is an old and well-developed technology and, if done correctly, the powder chemistry and size is homogeneous through the batch. Since there are millions of particles per kg, the powder will be consistent even for very small volumes in a thin powder bed layer.
The powder manufacturer will certify the blended chemistry and will not give any information on the lots used, like number of lots or their individual analysis or PSD.
Traceability
The powder manufacturer keeps track of heats made, how they were screened and how much were used in the blends.
The Additive Manufacturing parts producer should find out how the powder manufacturer composes the blend; in some cases, many heats and sub lots are used to make the blends. Put another way, all sorts of ‘leftovers’ may be combined for a batch.
If there is a production issue with a batch, it would be very difficult to identify the problem heat or heats. It is better to ask the powder producer to minimise the number of components of a blend if making critical parts. It may be possible to negotiate a discount if lots of ‘leftovers’ are used to make a batch.
Blended lot properties
The advantage with blended lots is that it is possible to produce a more consistent chemistry and PSD. Combining heats with higher and lower values will even out the analysis. It is even possible to bring out-of-spec heat chemistry into spec by blending with another heat to average out the analysis. Many aerospace and medical specifications require that all individual batches in a blend are within required ranges on powder analysis and size, which may prevent surprises in the built AM part.
Blending recycled powders in production
The fact that all AM powders are already blends makes it easier to recycle material. As the original powder producer keeps track of heats and lots and how a blend was combined, the AM part producer can do the same and rehomogenise powder lots to avoid disposing of good powder. This will involve careful documentation of chemical analysis and PSD, as well as the weight used. Naturally, a good blender and knowledge of blending techniques are also required.
Conclusion
As has been shown, Additive Manufacturing using metal powders has some unique requirements. The metal powder data that has been collected and reported on over many decades is very useful, but additional attention is required as AM technology is very different to other metal powder-based part production processes such as Powder Metallurgy, MIM, HIP and thermal spray. However, through additional analysis of PSD and chemistry, as well as the use of new open flow instruments, it is possible to control and improve the powders used in Additive Manufacturing.
Author
Toby Tingskog
Chief Consultant
3T Consulting
Orange County, CA
USA
Email: [email protected]
Toby is an independent consultant in metal Additive Manufacturing, MIM, HIP and other powder metallurgical technologies. He is an expert on the sales and market development of titanium, nickel/cobalt and stainless steel powders and has over ten years experience in the industry. He received a Masters from Lund Institute of Technology, Sweden, and an MBA from the University of California, Berkeley.

LAST MONTH’S MOST-READ ARTICLES