

Euro PM2021: Advances in the processing of nickel alloy 718 and molybdenum by Laser Beam Powder Bed Fusion (PBF-LB)
A technical session in the programme of the virtual Euro PM2021 conference, organised by the European Powder Metallurgy Association (EPMA) and held October 18-22, 2021, focused on issues related to the processing of nickel-base alloys and refractory metals by Laser Beam Powder Bed Fusion (PBF-LB) Additive Manufacturing. Dr David Whittaker reviews four papers that address microstructure control, lattice optimisation and chemical post-processing parameters for IN718, and the AM of molybdenum. [First published in Metal AM Vol. 8 No. 1, Spring 2022 | 35 minute read | View on Issuu | Download PDF]
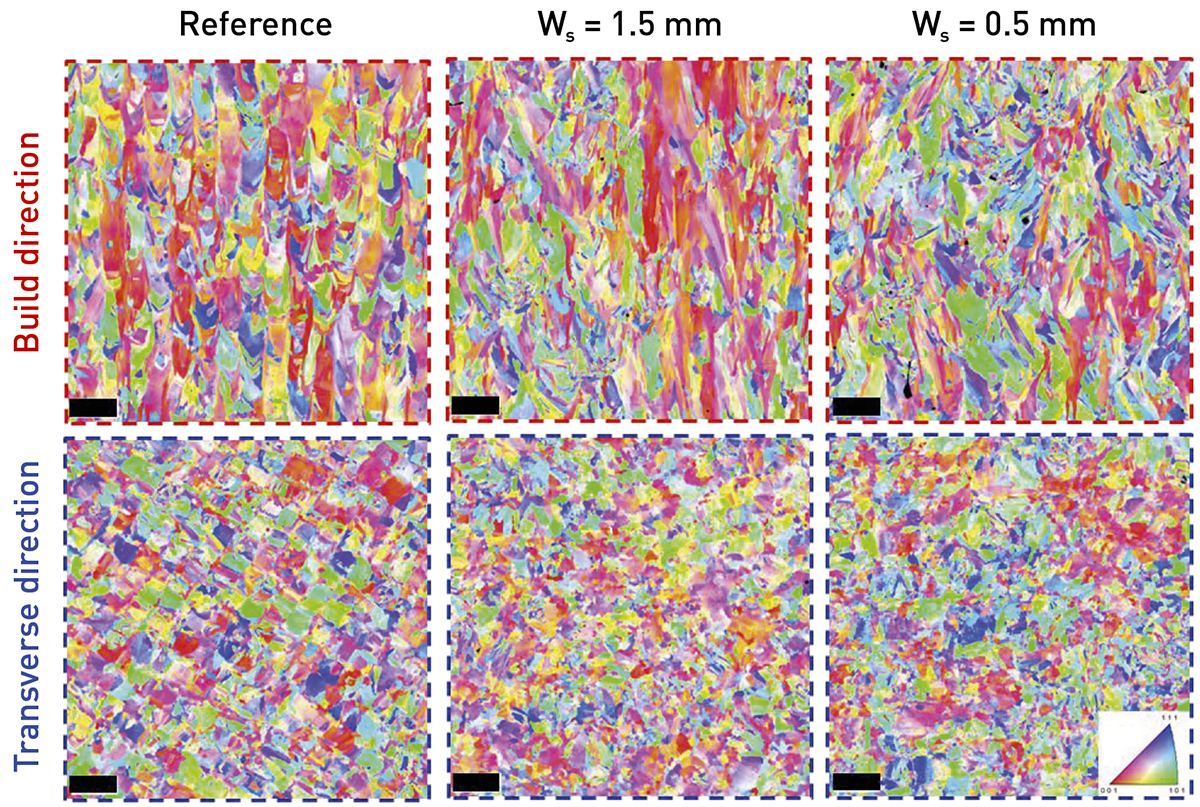
![Fig. 1 IPF maps of Reference, Ws = 1.5 mm and Ws = 0.5 mm for build (red dashed line) and transverse (blue dashed line) directions. Black scale on the bottom of the maps indicates 100 μm [1]](http://www.metal-am.com/wp-content/uploads/sites/4/2022/04/fig-01-2-1024x689.png)
Microstructure control of additively manufactured IN718 by PBF-LB
The first of the reviewed papers considered strategies for the control of microstructure in IN718, additively manufactured by the Laser Beam Powder Bed Fusion (PBF-LB) process [1]. The paper was authored by L Lacoste, S Depinoy and C Colin (Mines ParisTech – PSL University, France) and A Sakly, S Lebel and B Vayre (AddUp, France).
In PBF-LB, the combination of a layer-by-layer manufacturing process with a high thermal gradient and solidification rate results in epitaxial growth through multiple layers. Mechanisms governing the variation of the microstructure have been investigated in order to produce isotropic part and, most importantly, to adapt the microstructures of AM parts to their applications in service.
Reported literature has identified four interlinked major levers that can lead to isotropic microstructures. The first of these levers consists of reducing thermal gradients to reach the columnar-equiaxed transition (CET). However, for the PBF-LB process, this is difficult – even impossible – to achieve through variations of primary parameters such as laser power and scanning speed.
The preheating temperature is the most effective parameter for decreasing thermal gradients in the PBF-LB and Electron Beam Powder Bed Fusion (PBF-EB) processes. Unfortunately, in the case of the PBF-LB process, preheating systems are not yet mature enough for industrial use.
A second lever is the aspect ratio of the melt pool, which can be modified by standard PBF-LB parameters, by laser beam shaping or even by using a top-hat source instead of a Gaussian one. However, this requires the modification of the PBF-LB machine laser optical path, a rather complex operation.
More recently, some studies have focused on the addition of inoculants to the powder with significant results. The main drawback of this third lever is that any change in the chemical composition means a requalification process for industrial applications. The final lever is the inhibition of epitaxial growth. In layer-by-layer manufacturing, two types of epitaxial growth can be distinguished: transverse epitaxy, between two tracks side by side of the same layer, and axial epitaxy, between two tracks from one layer to another. The first epitaxy is mainly governed by the path of the laser beam and the overlap between two tracks and, therefore, by the hatch spacing. The second epitaxy is controlled by the axial dilution defined by the number of re-melted layers.
The reported study was aimed at investigating the impact of scanned length on epitaxy, in order to achieve an un-textured microstructure and a significant reduction in grain size.
10 x 10 x 12 mm3 specimens were built from a gas atomised IN718 powder, with a particle size distribution D10 = 10 μm and D90 = 53 μm and an average size D50 = 30 μm. A FormUp 350 machine from AddUp, with a laser power P = 220 W, a scanning speed Vb = 2100 mm.s-1 and a focused laser beam diameter ϕL = 70 μm, was used. The hatch spacing and the powder layer thickness were set at hs = 55 μm and ΔZ = 40 μm, respectively.
Strip scanning strategies were developed in the AddUp Manager software. The variable of interest in this design of experiments was the strip width, Ws. Strip widths of 0.5 mm, 0.75 mm, 1.0 mm and 1.5 mm were used. The scanning was orthogonal to the bands, so Ws is the scanning distance for one single track. A staggered strip scanning strategy was applied to reduce the overall thermal gradient in the blocks.
Finally, an incremental rotation of 67° from one layer to another was applied to avoid preferential growth directions and thus reduce the axial epitaxy. A reference block with a standard bi-directional scanning and a rotation of 90° between two layers was also built.
Samples were cut along two mid-planes in the build direction (BD) and in the transverse direction (TD) (i.e., orthogonal and parallel to the build plate). After standard polishing, EBSD analyses were carried out; an analysed area of 0.85 x 0.85 mm2 and a step of 0.5 μm were used. EBSD post-processing. as maps of inverse pole figures (IPF), grain aspect ratio (AR, min axis / max axis), grain size, texture analysis and the determination of the Taylor factor were achieved using the TSL OIM software package. IPF maps were computed with the <001> direction aligned with the build direction (BD).
Fig. 1 shows the IPF mapping along the BD and TD directions for the reference sample, the one with Ws = 1.5 mm and the one with Ws = 0.5 mm. The reference exhibited a classic microstructure with columnar grains spaced by a distance hs along BD, associated with a <001> texture. Square-based grains with a side of length hs were observed along TD. On the other hand, the wider strips (Ws = 1.5 mm) still had columnar grains with the <001> texture, but there was no regular basaltic pattern along BD and TD. The narrower strips (Ws = 0.5 mm) showed disorganised columnar grains of smaller size and no dominant crystallographic texture. Furthermore, decreasing Ws tended to change the grain morphology such that they became slightly less columnar.

Fig. 2 shows the number- and area-weighted grain size distributions as a function of Ws in both TD and BD directions, where the grain size, gs, is taken as the equivalent diameter. The number-weighted distribution is representative of the number of nucleation events that took place during the build, while the area-weighted distribution is more representative of the material at the macroscopic scale.
![Fig. 2 Normal distribution of the grain size weighted by the number of grains (Number) and the area of grains (Area) for BD (left) and TD (right) at the DoE WS values [1]](http://www.metal-am.com/wp-content/uploads/sites/4/2022/04/fig-02-2-1024x409.png)
Decreasing the strip width clearly leads to a less scattered grain size distribution and an overall smaller grain size regardless of the weight and of the direction of interest. Along BD, area- and number-weighted maximum grain size increased from 120 μm and 30 μm to 220 μm and 45 μm, when Ws was increased from 0.5 mm to 1.5 mm. A similar trend, albeit to a lesser extent, was observed in TD: a scanning width of 0.5 mm led to area- and number-weighted maximal grain sizes of 85 μm and 25 μm, respectively, and of 125 μm and 35 μm for a scanning width of 1.5 mm. It should be emphasised that the differences between BD and TD were related to the fact that the average aspect ratio is not fixed.
The texture index TI (i.e., the 16th order of the harmonic expansion) and the mean Taylor factor 〈M〉 were calculated to assess the effect of the scanning width on the crystallographic texture. The Taylor factor is a generalisation of Schmid’s law for polycrystalline materials and is equal to 3.06 when texture is random. A lower Taylor factor means that the material deforms more easily due to the preferential alignment of slip systems. The grain density gd (in mm-2), i.e., the number of grains per unit area, and the number- and area-weighted mean grain size, 〈gs〉 in μm, were used to summarise the results shown in Figs. 1 and 2, with reference to the fineness of the microstructure. Fig. 3 shows the evolution of these four parameters as a function of strip width, Ws.
![Fig. 3 Plots of the average grains size, 〈gs〉 (top left), the grains density, gd, (top right), the texture index, TI, (bottom left) and the average Taylor factor, 〈M〉, (bottom right) as a function of Ws [1]](http://www.metal-am.com/wp-content/uploads/sites/4/2022/04/fig-03-1-1024x825.png)
From Fig. 3, along BD, it can be seen that an increase in Ws induced higher values of 〈gs〉 and TI. On the other hand, a decrease in the parameters gd and 〈M〉 were observed with increasing Ws. In fact, the larger the grains, the lower was the grain density. This same tendency occurred between the texture index and the Taylor factor. It is also interesting to note that the measured quantities of TI and 〈M〉 for Ws = 0.5 mm were very close in the two directions BD and TD and tended towards isotropic values (1 and 3.06, respectively). Indeed, the relative differences between BD and TD for these quantities were 1.50% and 0.01 %, respectively, so that it could be safely assumed that there was no textural anisotropy in the thin strip sample, Ws = 0.5 mm.
In light of these results, thin strip strategies coupled with a 67° rotation between layers appears to be a promising approach to constructing more isotropic as-manufactured microstructures compared to conventional strategies.

Fig. 4 shows the appearance of new grains by plotting Δgd as a function of the melt pool length normalised by the strip width, Ws. From this figure, Δgd seems to evolve exponentially with Lmp / Ws. The more the melt pool length normalised by the strip width tends towards 1 – i.e., Lmp = Ws – the more new grains are formed. Indeed, there was a tenfold increase in new grains for the thinnest strip compared to the less fine one along TD and seven times more for BD. While the mechanisms leading to the increase in grain nucleation are not yet understood, the authors hypothesised that increasing Lmp / Ws above a given critical ratio (dependent on the scanning speed Vb) leads to the interaction of the laser beam with a larger volume that is not yet fully solidified from the previous track. This would have the effect of breaking the secondary arms of the dendrites during solidification, which would then act as heterogeneous nucleation sites ahead of the solidification front, effectively inhibiting transverse epitaxy.
![Fig. 4 Contribution of the strip strategy in terms of new grains, Δgd, as a function of the normalised width strip, Lmp / Ws [1]](http://www.metal-am.com/wp-content/uploads/sites/4/2022/04/fig-04-1-1024x854.png)
As can be seen from Fig. 5, these results have paved the way for the production of isotropic parts and parts with different microstructural areas or microstructural gradient. Some interesting results require further study. In order to have a better understanding of the phenomena that occur during the remelting of a melt pool that is not fully solidified, the numerical simulation of a melt pool in steady state and in a transient regime can be of great help.
Finally, it is necessary to consider the scanning time for the entire part. These narrow strip strategies have the drawback of having a low build rate. The strategy at Ws = 500 μm requires a scan time three times longer than that for the reference strategy, dramatically increasing the production time. However, using the developed strategy at specific locations in a part to modify the microstructure and increase local mechanical properties is undoubtedly the best solution available to end-users.
Optimisation of PBF-LB Inconel 718 lattice structures for improving mechanical behaviour
The second paper remained with the same nickel superalloy, IN718, and addressed the optimisation of lattice structures built by PBF-LB for improving mechanical behaviour. This paper came from Shruti Banait, Xueze Jin and Teresa Perez- Prado (IMDEA Materials Institute, Spain) and Monica Campos (Universidad Carlos III de Madrid, Spain) [2].
Lattice structures are characterised by the repetition of a unit cell in three dimensions, thus consisting of a topologically ordered open-celled structure. The topology of strut-based lattice structures is inspired by crystalline lattice structures. Cubic, body centred cubic (bcc), face centred cubic (fcc), diamond, and octet-truss are some strut-based topologies.
Numerous researchers have reported the mechanical response of lattice structures in the literature, considering different cell topologies, such as bcc, fcc and their variants. Defects formed during the PBF-LB process may significantly affect mechanical response. These effects are more pronounced in shear loading than in compression loading. Lattice structures with larger strut diameters and smaller cell size exhibit higher modulus and thus better energy absorption properties. The overall mechanical response of the lattice structure is greatly influenced by parameters such as strut diameter, unit cell topology, cell size and relative density of the lattice.
Very few results have been reported in the literature on manufacturability studies for lattice structures in order to achieve optimal design and a negligible fraction of defects. Also, limited results have been reported, to date, on lattice structures fabricated with Ni-base superalloys, despite these alloys being compatible with PBF-LB technology. The work reported in this paper aimed to fill this gap by investigating the lattice structures fabricated with IN718 by PBF-LB technology. The work presented consisted of optimisation of bcc lattice strut diameter and process parameters in order to obtain enhanced mechanical performance.
The powder used in the study had a particle size distribution ranging from 15 to 45 µm and the composition quoted in Table 1. The fabrication of the bcc lattices was carried out on a Renishaw AM 400 machine with a reduced build volume (RBV) of 78 mm x 78 mm x 55 mm. This system utilises a pulsating Yb fiber laser with a 400 W optical system, which gives out a focused beam of 70 μm diameter. The material used for the build plate was S 275 steel.
![Table 1 Chemical composition of IN718 [2]](http://www.metal-am.com/wp-content/uploads/sites/4/2022/04/table-01-1-1024x102.png)
In order to optimise the strut diameter, three lattices were manufactured with 0.3, 0.4 and 0.5 mm strut diameters and 10 x 10 x 10 mm dimensions. The process parameters employed for the fabrication are indicated in Table 2. For each lattice, the support structure was detached from the base using an abrasive disc cutter.
![Table 2 PBF-LB process parameters employed for strut diameter optimisation [2]](http://www.metal-am.com/wp-content/uploads/sites/4/2022/04/table-02-1024x113.png)
To fix the optimal strut diameter for the lattice structure, the lattices shown in Figs. 6 (a), (b) and (c) were tested at room temperature compression. The resultant stress-strain curves are indicated in Fig. 6 (d). In the case of the samples with 0.5 mm and 0.4 mm strut diameters, the stress increased with strain monotonically, then remained basically constant during a plateau stage, before a final increase due to lattice collapse. The final sharp rise in stress indicates the interlocking of struts with no further room for compression. The stress-strain curve corresponding to the 0.3 mm strut diameter lattice showed no significant strength due to the breakage of struts immediately upon the application of the compressive stress.
![Fig. 6 Bcc lattices fabricated with process parameters from Table 2, having strut diameters (a) 0.5 mm, (b) 0.4 mm, (c) 0.3 mm and (d) stress-strain curve for room temperature compression [3]](http://www.metal-am.com/wp-content/uploads/sites/4/2022/04/fig-06-1-1024x743.png)
Since strut diameters of 0.4 and 0.5 mm appear to endow the built lattices with a relatively similar mechanical behaviour, the choice between these two diameters was guided by previously published observations that reported an increase of the internal porosity of PBF-LB processed Ni superalloy lattices with increasing strut diameter. On the basis of this observation, the 0.4 mm strut diameter was selected as the optimal one. Hereafter, all the reported results correspond to lattices with a strut diameter of 0.4 mm.
After selecting 0.4 mm strut diameter as the optimal choice, the porosity in the lattice struts and nodes was optimised by designing an array of different levels of selected process parameters, as indicated in Table 3. Eight new combinations were considered, together with the one defined in Table 2.
![Table 3 PBF-LB process parameters employed for porosity optimisation [2]](http://www.metal-am.com/wp-content/uploads/sites/4/2022/04/table-03-1024x447.png)
A typical scan volume shows three distinct areas: fill hatch, fill contour and border, followed by upskin and downskin. The downskin is always supported by the powder layer beneath it, resulting in an irregular contour. The downskin from the manufacturing process cannot be eliminated completely but can be reduced to a minimum value.
To refine the geometry and the density of the lattices further, another process parameter campaign was carried out, this time varying the downskin parameters and number of volume borders. Laser power, border power, scan speed fill, scan speed border, hatch distance, energy density fill and energy density border were selected as combination number 4 from Table 3.
For both the process parameter optimistion campaigns, the bcc lattices were manufactured with a strut diameter of 0.4 mm and a dimension of 7.5 x 7.5 x 7.5 mm. For all the fabrications, a layer thickness of 30 μm and ‘meander’ scanning strategy was used.
It was observed that the porosity is significant and the downskin is irregular. The lattices fabricated in accordance with the process parameters indicated in Table 3 were examined to calculate the % porosity. Table 4 shows the respective values of % porosity for these lattices.
![Table 4 Percentage porosity calculated for porosity optimisation (respective lattice and pore areas are in mm2) [2]](http://www.metal-am.com/wp-content/uploads/sites/4/2022/04/table-04-1024x304.png)
It was observed that lattice cross sections with borders exhibit a superior geometrical form as compared to those without borders. It was also noted that sample number 4 from Table 4 exhibits the lowest porosity in the category of lattices with border. However, the downskin was still irregular. Therefore, another optimization campaign was followed for the purpose of improving the downskin and understanding the effect of borders for the process parameters of sample 4.
Table 5 shows the values of % porosity for the levels of parameters in the second porosity campaign. It was observed that the border is, indeed, important for maintaining the geometry of the lattice. Thus, scanning parameters were selected in order to better retain the geometrical shape of the downskin in the lattice and to achieve a significant low level of porosity.
![Table 5 Percentage porosity calculated for porosity optimisation – 2, (respective lattice and pore areas are in mm2) [2]](http://www.metal-am.com/wp-content/uploads/sites/4/2022/04/table-05-1024x233.png)
Effect of chemical post-processing parameters on the surface roughness reduction and support removal of IN718 produced by PBF-LB
IN718 was again the material of choice in the third reported study. This paper came from David Pazos, Elixabete Espinosa and Belen Garcia-Blanco (CIDETEC, Spain) and Ione Golvano (Egile Mechanics, Spain) and considered the effect of chemical post-processing parameters in surface roughness reduction and support removal in parts produced by PBF-LB [3].
High surface roughness in AM parts arises from the layer-by-layer nature of the AM process, its manufacturing parameters and the orientation of the component. Defects during fabrication are generally represented by the staircase effect, due to the laser layers, partially melted powder particles, spatter or balling effects. Several methods have been developed in the past to reduce the surface roughness of as-built parts, with machining, shot peening, vibrating or (electro)chemical polishing being leading examples.
Support structures are necessary when manufacturing parts using PBF-LB. These structures have two main functions: firstly, to avoid part deformation attaching the work piece to the build platform and, secondly, to act as paths for dissipation of heat generated during manufacturing. Usually, supports are removed manually, by machining or by (electro)chemical treatments.
This reported study focused on chemical methods for removing support structures and decreasing surface roughness of IN718 PBF-LB parts.
The powders used in this study were gas atomised and had a particle size distribution in the range from 15 to 45 μm and the composition shown in Table 6. The build was carried out on a Renishaw AM 400 machine, equipped with a 400 W fibre laser and a build platform of 250 x 250 mm2. Processing was carried out in an argon atmosphere with an oxygen control of < 0.1% and preheating the building platform at 150°C. The samples were built using an energy density in the range 35-45 J/mm3, a layer thickness of 60 μm and a stripe scanning strategy in order to minimise the residual stresses generated during the process. The support structures used were designed both for boosting the heat dissipation and for subsequent chemical dissolution.
![Table 6 Chemical composition of IN718 powder [3]](http://www.metal-am.com/wp-content/uploads/sites/4/2022/04/table-06-1024x79.png)
Two different part geometries were selected to investigate the roughness and support dissolution with the same electrolyte (etching agent); a flat plate geometry and a cantilever geometry. The flat plate geometry was selected to evaluate the importance of certain parameters on surface roughness and mass reduction and the cantilevers were used to validate the applicability of these initial results to the dissolution of support structures.
A Fractional Factorial based Taguchi methodology Design of Experiments (DoE) was used to optimise the main etching process parameters in order to obtain the highest surface roughness decrease and the highest mass reduction.
![Table 7 DoE settings for roughness and mass evaluation on flat (top) and cantilever (bottom) samples [3]](http://www.metal-am.com/wp-content/uploads/sites/4/2022/04/table-07-1024x679.png)
The parameter selection was based on previous experience and on information from a literature review. Etchant composition and concentration, temperature and process time are the main parameters affecting the etching process of IN718. In this study, the etchant was kept constant as a modified aeronautical approved etchant and temperature and time were selected as DoE factors. Parameters related to etchant movement and hydrodynamics were also selected as factors in the DoE, since gas formation during etching, heat evolution by exothermic etching reactions, or mechanical agitation induces large-scale convection in the etching solution and this form of material transport contributes to a fast and homogeneous etching. The selected parameters related to electrolyte movement have been ultrasonic stirring (US), air bubbling, etchant recirculation with an eductor and sample movement. The levels and settings for each of the parameters are detailed in Table 7 and Table 8.
![Table 8 L8 experimental matrix for 1st and L4 experimental matrix for 2nd DoE [3]](http://www.metal-am.com/wp-content/uploads/sites/4/2022/04/table-08-1024x1024.png)
The statistical measure of performance used to evaluate product quality was the so-called signal-to-noise (S/N) ratio. When analysing the signal-to-noise ratio, the larger the difference between the lower and upper limit, the more relevant the corresponding parameter will be in the process.
![Fig. 7 Roughness (Ra in μm) of flat samples in the as-built condition according to their position on the build plate [3]](http://www.metal-am.com/wp-content/uploads/sites/4/2022/04/fig-07-1024x215.png)
Surface roughness characterisation of as-built and treated samples was carried out using a profilometer. The average value of standard surface roughness Ra (arithmetical mean) was reported according to the ISO 25178 standard. Measurements were performed on three random areas on the y-axis per sample. Results were shown as the % roughness reduction, due to roughness differences in the as-built parts produced by PBF-LB (see Fig. 8). Mass reduction was evaluated using a precision balance, measuring the mass before and after the chemical treatment.
![Fig. 8 Main effects plot both for S/N ratio of 1st DoE (right) and roughness and mass reduction (left) [3]](http://www.metal-am.com/wp-content/uploads/sites/4/2022/04/fig-08-1024x418.png)
The results of the first DoE are shown in Table 9 and plotted in Fig. 8. It can be observed that both surface roughness and mass reduction are mainly affected by temperature and time, in accordance with previously published results. With reference to the parameters related to electrolyte movement, bubbling and electrolyte movement with an eductor seem to be the parameters with most effect on surface roughness reduction.
![Table 9 S/N response of roughness (top) and mass (bottom) reduction for 1st DoE [3]](http://www.metal-am.com/wp-content/uploads/sites/4/2022/04/table-09-1024x851.png)
In order to evaluate the effect of chemical etching on support removal, the second DoE, detailed in Table 7 and Table 8, was carried out to consider parameters and levels that led to a higher mass reduction but expanding their level. Time was fixed at its upper level, considering temperature as a variable parameter and increasing its value. Bubbling and electrolyte movement with an eductor were also selected as parameters but with higher values to evaluate whether these movements allow the etchant to penetrate further between the supports and, thus, achieve a faster dissolution.
![Table 10 S/N response of roughness (top) and mass (bottom) reduction for 2nd DoE [3]](http://www.metal-am.com/wp-content/uploads/sites/4/2022/04/table-10-1024x511.png)
Table 10 and Fig. 9 show the results obtained in this second DoE. Again, and as previously reported in the literature for other materials treated by chemical etching, temperature is the factor that most influences surface roughness and mass reduction and, the higher the temperature, the higher the surface roughness and mass reduction. However, factors such as sample movement or bubbling do not seem to follow this same relationship. Further research needs to be carried out to analyse this behaviour, since very little literature has been published on the subject.
![Fig. 9 Main effects plot both for S/N ratio of 2nd DoE (right) and roughness and mass reduction (left) [3]](http://www.metal-am.com/wp-content/uploads/sites/4/2022/04/fig-09-1024x450.jpg)
The next step in the Taguchi methodology comprised solving a prediction equation, in which a projection of the % roughness and mass decrease is obtained according to the optimum parameters sequence. In this case, the optimal combination of factors for highest surface roughness reduction was A1-B1-C1-D2-E2-F2 and, for highest mass reduction, A1-B1-C1-D1-E2-F2. On the other hand, the combinations A2-B2-C1 and A1-B1-C1 achieved both the major surface roughness and mass reductions when working with cantilevers.
A good agreement was found between the experimental and the predicted results, confirming that the experimentation based on the Taguchi method had been properly conducted to explore the system response for the different levels of the input parameters (control factors).
Feasibility of grain refinement by heterogeneous nucleation in molybdenum PBF-LB
The final paper turned attention to the AM processing of refractory metals. This paper was by L Kaserer, L Rissbacher, J Braun, G Leichtfried (University of Innsbruck, Austria) and H Kestler (Plansee SE, Austria) and addressed the feasibility of grain refinement by heterogeneous nucleation in molybdenum processed by PBF-LB [4].
PBF-LB Mo components show a coarse, epitaxially grown columnar microstructure interspersed with cracks. These defects can be effectively suppressed by alloying with carbon. An addition of 3.5 at.% carbon triggers cellular solidification and grain refinement to a size of approx. 36 μm, through the effect of constitutional supercooling. The grains of carbon-modified Mo are composed of colonies of α-Mo cells with a crystallographic misorientation angle of < 0.5°. The individual cells have a size of approximately 1 μm and are surrounded by a Mo2C network. The mean grain size compared to pure Mo is significantly reduced; with increasing content of carbon up to the eutectic composition, the constitutional supercooling and hence the grain refinement increases. With a content of 15 at.% C, which is just below the eutectic composition of 17 at.%, a grain size of approx. 10 μm is achieved [5]. However, as the carbon content increases, the volume fraction of Mo2C also increases. For Mo with 3.5 at.% carbon, the Mo2C content is 8.5 vol.%.
This results in an increase in strength and hardness, but also in embrittlement. In order to achieve strong grain refinement without simultaneous embrittlement, an alternative grain refining mechanism would have to be used. In other alloy systems, such as aluminium alloys, the addition of heterogeneous grain refiners is carried out with great success. While grain refinement by heterogeneous nucleation is the preferred approach for grain refinement in many alloying systems in PBF-LB, its feasibility for Mo-based alloys has not yet been demonstrated.
The work reported was aimed at evaluating, both theoretically and experimentally, the feasibility of grain refinement through introducing particles that act as potent nucleate particles seeding equiaxed grains in Mo processed by PBF-LB.
Suitable compounds that can act as potent nucleate particles need to have the smallest possible lattice mismatch with the α-Mo matrix and either need to remain stable and solid or form in-situ in the Mo melt. Identifying suitable compounds for Mo is challenging due to its high melting point (2,623°C). The compounds with the highest reported melting points are the carbides hafnium carbide, (HfC) and tantalum carbide (TaC), at 4,000°C and 3,770°C, respectively. They have a body-centred cubic structure and a lattice mismatch δ of 0.47 (HfC) and 0.42 (TaC) compared to Mo. They are, in principle, suitable nucleating agents. However, simulations show that the temperatures in a PBF-LB Mo melt pool can locally exceed the melting points of both carbides and reach Mo’s boiling point of 4,639°C.
In the thermodynamic equilibrium, both carbides will not remain stable in the Mo melt, but dissociate. Also, according to the ternary phase diagrams, the in-situ formation of Hf/Ta carbides in the Mo melt does not occur at concentrations of these alloying elements that allow a material with high metallic phase fraction. The isothermal sections of the respective ternary phase diagrams at 3,000°C shown in Fig. 10 (a) and (b) illustrate this fact.
![Fig. 10 Ternary phase diagrams for a) Hf–Mo–C and b) Ta–Mo–C at 3,000°C [4]](http://www.metal-am.com/wp-content/uploads/sites/4/2022/04/fig-10-1024x500.jpg)
Deviations from these theoretical predictions may occur and HfC and TaC may partially remain stable in the melt if the dissociation temperature of the carbides is only exceeded locally in the Mo melt and/or the high heating and cooling rates in PBF-LB prevent the thermodynamic equilibrium state from being reached.
In the experimental programme, spherical Mo powder with metallic purity of > 99.9% was mixed with TaC and HfC nanopowders using a ball mill. The milling parameters were chosen so that the nanopowders were homogeneously distributed on the surface of the spherical Mo particles. Subsequently, the powders were sieved at a mesh size of 63 μm. Preliminary tests showed that the Mo-HfC samples had a significantly lower Hf and C content after PBF-LB production, than would correspond to the added amount of HfC. For Mo-TaC samples, this was not observed. This might be due to poorer adhesion of the HfC nanopowder particles to the Mo powder particles than is the case with TaC. Therefore, significantly more HfC (12 wt.%) than TaC (4 wt.%) nanopowder was added to Mo to compensate for the expected loss.
Table 11 summarises the properties of the powder mixtures. The tap/bulk density was measured according to ASTM B527, the chemical specifications for C were measured using the combustion method (LECO CS-230), for O, N, H carrier gas hot extraction (LECO TC-500), and, for Ta and Hf, using XRF spectroscopy.
![Table 11 Powder properties [4]](http://www.metal-am.com/wp-content/uploads/sites/4/2022/04/table-11-1024x564.jpg)
The PBF-LB processing was performed on an AconityLAB system. Samples with a size of 10 x 10 x 10 mm were produced.
Table 12 shows the properties of the Mo-TaC and Mo-HfC PBF-LB samples. Both samples showed equally high densities, indicating good processability of both powders. The carbon content of Mo-HfC is higher than that of Mo-TaC, because the amount of carbide added to the starting powder was higher. Mo-HfC samples also show a smaller mean grain size and a higher hardness compared to Mo-TaC.
![Table 12 Comparison of physical, chemical, crystallographic, and mechanical properties of the PBF-LB samples [4]](http://www.metal-am.com/wp-content/uploads/sites/4/2022/04/table-12-1024x393.jpg)
The mean grain sizes in Table 12 were calculated from the area in the corresponding EBSD images. These images showed a higher degree of grain refinement and the stronger suppression of columnar grains in the side view in Mo-HfC compared to TaC. For both samples, the EBSD maps did not show evidence of the formation of equiaxed grains. This statement is also true for the EBSD maps at higher magnification.
The microstructure investigated by SEM and EDX is shown in Fig. 11, representative of both samples for Mo-HfC. It shows a cellular sub-grain structure consisting of cells surrounded by a carbide network. The cell size was related to the position in the melt pool and was smaller for areas close to the melt pool boundary on the inner side of the former melt pool. EDX measurements revealed that cells, in the case of Mo-HfC, contained Mo and Hf and, in the case of Mo-TaC, Mo and Ta. Hf or Ta was at least partially dissolved in Mo.
![Fig. 11 SEM image showing the cellular sub-grain structure of the Mo-HfC sample. The cell size is related to the position in the melt pool. EDX measurements show that cells contain Mo and Hf, while the cell boundary contains Mo, Hf, and C. For Mo-TaC, similar results are obtained, except that Hf is exchanged with Ta [4]](http://www.metal-am.com/wp-content/uploads/sites/4/2022/04/fig-11-1024x635.jpg)
Consequently, the hardness of Mo-HfC and Mo-TaC was increased compared to samples with the same amount of carbon (see Fig. 12 (a)). Hf and Ta lead to solid solution hardening and thus to further embrittlement of the material. The phase surrounding the cells as a network contained Hf/Ta, Mo, and C. It can be assumed that Hf/Ta form ternary carbides with Mo. The microstructure was similar to that of Mo alloyed only with carbon, except that Hf and Ta were dissolved in Mo, forming ternary carbides instead of Mo carbide.
![Fig. 12 a) Mean grain size (side view) and b) hardness of Mo-TaC and Mo-HfC samples compared to samples with similar carbon contents to show the effect of Ta and Hf. Percentages in at.% [4]](http://www.metal-am.com/wp-content/uploads/sites/4/2022/04/fig-12-1024x426.jpg)
It can be concluded that TaC and HfC completely dissociate in the Mo melt during the PBF-LB process and, thus, have no effect as heterogeneous grain refiners.
The effects of HfC and TaC additions on the mean grain size, compared to additions of the same amount of C, are shown quantitatively in Fig. 12 (b), Ta and Hf have a mild grain refining effect, which enhances the effect of C. However, the main mechanism for grain refinement in Mo-TaC/HfC is still triggered by carbon-induced constitutional supercooling. Calculating the growth restriction factor Q supports this statement. Carbon has a Q value of 23 K/at.% in Mo. Hf and Ta contribute slightly through different mechanisms. The effect of Hf can also be attributed to constitutional supercooling. Calculating Q for Hf in Mo gives a value of 4 K/at.%. C is approximately six times more effective as a grain refining agent in Mo than Hf. For Ta, constitutional supercooling cannot cause grain refinement, since Ta has full solubility in Mo. The grain-refining effect of Ta in Mo might be explained by the fact that it hinders the diffusion of carbon in the Mo melt. Thus, Ta might cause the carbon concentration in front of the solid-liquid interface to have a steeper gradient and slightly increase the constitutional supercooling effect of C.
Author and contacts
Dr David Whittaker
Tel: +44 1902 338498
[email protected]
[1] Luc Lacoste, Mines ParisTech – Centre des Matériaux – PSL University – AddUp – Additive Factory Hub, France.
[email protected]
[2] Shruti Banait, IMDEA Materials Institute, Spain,
[email protected]
[3] David Pazos, CIDETEC, Basque Research and Technology Alliance (BRTA), Spain. [email protected], and
Belén García, [email protected]
[4] Lukas Kaserer, University of Innsbruck, Austria.
[email protected]
References
[1] Microstructure Control Of Additively Manufactured IN718 By L-PBF Process, L Lacoste, A Sakly, S Dépinoy, S Lebel, B Vayre, C Colin. As presented at the Euro PM2021 Virtual Congress, October 18–22, 2021, and published in the proceedings by the European Powder Metallurgy Association (EPMA)
[2] Optimization of SLM Lattice Structures of Inconel 718 For Improving the Mechanical Behaviour, S Banait; X Jin, M Campos, T Pérez-Prado. As presented at the Euro PM2021 Virtual Congress, October 18–22, 2021, and published in the proceedings by the European Powder Metallurgy Association (EPMA)
[3] Effect of chemical post-processing parameters on the surface roughness reduction and support removal of IN718 produced by selective laser melting, D Pazos, E Espinosa, I Golvano, M B García-Blanco. As presented at the Euro PM2021 Virtual Congress, October 18–22, 2021, and published in the proceedings by the European Powder Metallurgy Association (EPMA)
[4] Feasibility of grain refinement by heterogeneous nucleation in molybdenum processed via Laser Powder Bed Fusion, L Kaserer, L Rissbacher, J Braun, H Kestler, G Leichtfried. As presented at the Euro PM2021 Virtual Congress, October 18–22, 2021, and published in the proceedings by the European Powder Metallurgy Association (EPMA)
[5] J Braun, L Kaserer, J Stajkovic, P Singer, H Kestler, G Leichtfried, Grain refinement mechanisms of alloying molybdenum with carbon manufactured by laser powder bed fusion, Working Paper, University of Innsbruck, Austria, 2021
LAST MONTH’S MOST-READ ARTICLES