

AMPM2018: Process parameter control, corrosion resistance and feedstock extrusion highlighted
AMPM2018, the fifth annual Additive Manufacturing with Powder Metallurgy Conference, was held in San Antonio, Texas, USA, from June 17-20, 2018. The event continues to enjoy impressive growth as the breadth and depth of its technically focused progamme expands. In this report, Dr David Whittaker reviews three presentations that cover the characterisation of hard-to-weld nickel-base superalloys, the corrosion behaviour of 420 stainless steel and the extrusion of feedstock containing water atomised 17-4 PH stainless steel powder. [First published in Metal AM Vol. 4 No. 3, Autumn 2018 | 20 minute read | View on Issuu | Download PDF]

The AMPM (Additive Manufacturing with Powder Metallurgy) conference series, sponsored by North America’s Metal Powder Industries Federation (MPIF), was initiated in 2014, running in parallel with the POWDERMET2014 conference, Orlando, Florida. The fifth conference in the series, which continues to run in parallel with the POWDERMET conference, was held in San Antonio, Texas, June 17-20, 2018. Contributions to the conference covered a broad range of topic areas, including process parameter control for difficult-to-process materials, achievable properties in AM-processed materials and studies of ‘MIM-like’ AM processes. This report will review examples of presentations in each of these categories.
Characterisation of hard-to-weld nickel-base superalloys
In the first category, Kristiina Kupi, Abdul Shaafi Shaikh, Kevin Minet-Lallemand and Tatu Syvanen (EOS Finland) discussed a study of the processing of hard-to-weld nickel-base superalloys by what EOS calls Direct Metal Laser Sintering (DMLS), or Laser Powder Bed Fusion (LPBF). Nickel-base superalloys, on the basis of their excellent high-temperature corrosion and creep resistance, are largely used in aerospace and land-based gas turbine engines.
Alloys such as IN939, IN738 and MAR-M247 are required for components with high service temperature and generally contain a high fraction of ‘gamma prime’ strengthening phase. Unfortunately, their poor weldability is a challenge for production by Additive Manufacturing [1]. The nature of layer-wise manufacturing, with fast cooling rates and heat cycling, can potentially form cracks through different mechanisms such as HAZ liquation, solidification cracking and strain-age cracking.
The reported study focussed on the effect of the DMLS process on defect formation within hard-to-weld superalloys and on attempts to improve weldability through the adjustment of critical process input factors. The process monitoring tool EOSTATE MeltPool was used to observe melt pool behaviour and detect locally overheated areas.
The DMLS machine used for building experimental samples was an EOS M 290 system equipped with EOSTATE MeltPool, a photodiode-based monitoring system. When the standard process window is set, MeltPool monitoring can be utilised to spot differences between process parameters and deviations in processing. In this study, the on-axis photodiode was used for the measurements.
The material selected for the experiments was EOS Nickel Alloy IN939, with a nominal composition as presented in Table 1. The usual particle size distribution (PSD ~ 15-45 µm) and morphology for DMLS were used.
![Table 1 Nominal composition of IN939 – all values in wt.% [1]](http://www.metal-am.com/wp-content/uploads/sites/4/2018/09/t01-1024x80.jpg)
The key process input parameters, namely laser power, scan speed and hatch vector spacing, exert a strong influence on the resulting microstructure and quality of the processed part within a defined layer thickness. However, surface properties and buildability are also partly determined by the bulk parameters (hatch vectors that create the solid part). Accordingly, the effect of the key process input parameters was first characterised.

To be able to investigate the effect of key process input factors on the resulting melt pool dimensions and creation of different kinds of defects, different process parameters were used to build the sample geometries, but no additional parameters were used to improve the surface properties. The hatch vector orientation was rotated from layer to layer by 67° to homogenise the structure. The key factors are presented in Table 2.
![Table 2 Main process parameters used for manufacturing the test parts [1]](http://www.metal-am.com/wp-content/uploads/sites/4/2018/09/t02-1024x375.jpg)
The power used in the experiments varied between 100 and 370 W. The volume energy density Ev is calculated from the key process input factors:
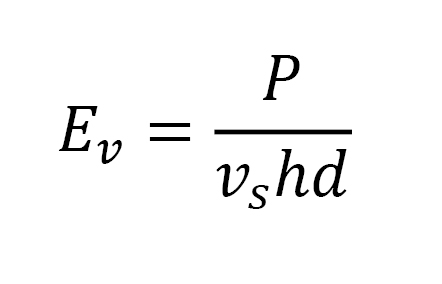
where P is laser power, vs is the scanning speed, h is the hatch vector spacing and d is the layer thickness.
To optimise the bulk properties, but also the buildability and surface properties of the manufactured parts, more fine-tuning parameters were taken into the experimental loop. These parameters are aimed at reducing heat accumulation in areas where the hatch vectors are not exposed in full length and where the component contains, for example, thin walls and fine details. Also, down-facing areas are typically problematic to build without overheating because of the reduced heat conductivity of the powder bed compared to the solid part. These parameters are referred to as the ‘Power Reduction Factor’ and ‘Time Homogenisation’. The Power Reduction factor (PR) reduces the laser power as a function of vector length and Time Homogenisation (TH) homogenises the energy input for short hatch vectors, by keeping the energy input per unit time and volume constant. These factors were used together with Parameter 2.
![Fig. 2 Melt pool with (a) Parameter 1, (b) Parameter 2, (c) Parameter 3 and (d) Parameter 4 [1]](http://www.metal-am.com/wp-content/uploads/sites/4/2018/09/02-1024x793.jpg)
The effects on melt pool size and shape of the different key process parameters are shown in Fig. 2. Parameter 1, with the lowest energy input, results in the shallowest melt pool, while Parameter 3 produces a deeper melt pool. Moreover, the effect of a change in hatch spacing (Parameter 4 compared to the others) is noticeable. The average melt pool depths and widths resulting from the different parameters were measured and are presented in Table 3.
![Table 3 Melt pool dimensions with Parameters 1-4 [1]](http://www.metal-am.com/wp-content/uploads/sites/4/2018/09/t03-1024x320.jpg)
In addition to changes in melt pool depth, the process parameters also change the width and shape of the melt pool. The width-to-depth ratio increases from Parameter 1 to Parameter 3. With Parameter 4, the melt pool depth is increased significantly and the impact of key-hole can be plainly observed.
The process parameters used also affect the formation of diverse defects. Insufficient energy density results in improperly molten powder layers, as seen in Fig. 3(a). Parameter combinations resulting in higher energy density yield a fully dense microstructure as seen in Fig. 3(b). The lack-of-fusion defects in the sample, built with Parameter 1, are due to improper melting of powder layers. The melt pool depth for Parameter 1 was measured to be around 67 µm. The melt pool for Parameter 2 was measured to be around 89 µm deep and, in this case, complete fusion was achieved. Hence, it was inferred that, for a layer thickness of 40 µm, the melt pool should be at least 80 µm deep, i.e. twice the layer thickness.
![Fig. 3 Defects in samples built with (a) Parameter 1, (b) Parameter 2, (c) Parameter 3 and (d) Parameter 4 [1]](http://www.metal-am.com/wp-content/uploads/sites/4/2018/09/03-1024x781.jpg)
High energy density may result in a higher level of cracking, as seen in Fig. 3(c) (Parameter 3). With Parameter 4, the hatch spacing was increased from Parameter 2 and laser power and scanning speed were adjusted to reach the desired energy density. Even though the energy densities are close to each other, Parameter 4 creates more cracks. This shows that it is not just overall energy density, but a combination of individual process parameters, that may cause cracking. The resulting melt pool for Parameter 4 (~ 204 µm) is much deeper than for Parameter 2 (~ 89 µm). The larger melt pool may result in slower cooling, allowing more time for segregation of low-melting elements. Hence, the ideal process parameters must be balanced between having just enough energy density to ensure melting across two layers and achieving cooling rates high enough to avoid detrimental segregation.

The DMLS process is operable over a range of layer thicknesses. The chosen layer thickness not only has a profound effect on productivity, but also affects the energy density required to produce a consistent and defect-free microstructure. It was observed that a 20 µm layer thickness processed with energy density in excess of 100 J/mm3 (Parameter 5) produced a very high crack density in the built material.
The effects of process parameters on surface quality of down-facing areas and up-facing surfaces were examined with samples, which included a 45° angle, and sample cubes with an up-facing surface. The aim was to be able to evaluate the severity of overheating and resulting surface properties of the built parts. The results of the roughness measurements are presented in Fig. 4.
![Fig. 4 Process parameters’ effects on surface roughness of 45° angle down-facing surface. The used process parameters correspond with the ones in Table 2. PR = Power Reduction factor with Parameter 2, TH = Time Homogenisation with Parameter 2 [1]](http://www.metal-am.com/wp-content/uploads/sites/4/2018/09/04-1024x364.jpg)
As can be observed from Fig. 4, the energy density for the bulk also affects the properties of the down-facing areas below the 45° angle. Parameter 1 with the lowest energy density results in the best surface roughness, while Parameter 3, with the highest energy density, results in the worst surface roughness. The roughness of the surface built with Parameter 2 can be further improved with the Power Reduction Factor and, even more, with Time Homogenisation (TH). Similar observations can be made from top surface profiles. When energy density is insufficient, some balling occurs and the powder is not fully molten and, when there is an excessive amount of energy, the top surface is not as flat and the sample edges start to rise. These raised edges may cause buildability issues by interfering with the recoating process.
![Fig. 5 EOSTATE MeltPool data visualisation: (a) Parameter 1, (b) Parameter 2, (c) Parameter 3, (d) Parameter 2 with Power Reduction Factor, (e) Parameter 2 with Time Homogenisation [1]](http://www.metal-am.com/wp-content/uploads/sites/4/2018/09/05-1024x200.jpg)
The overheating of certain parts and areas in the samples can be readily observed with the EOS MeltPool monitoring tool. Analysis tools were used to visualise and measure the change in intensity levels caused by the different energy inputs and short vectors, as shown in Fig. 5. One clear observation is the difference between Parameters 1, 2 and 3, (Figs. 4(a), (b) and (c)), in which the increased energy density affects the intensity profile. In addition, the effect of Power Reduction factor and Time Homogenisation on the shortest hatch vectors is seen, when comparing Fig. 5(b) to Figs. 5(d) and (e). The mean intensities, calculated with the offline toolbox, are presented in Table 4. The mean intensity was calculated for each Parameter from the data recorded by the on-axis photodiode.
![Table 4 Calculated mean intensities from EOSTATE MeltPool Analysis Toolbox (with intensity corrected data) [1]](http://www.metal-am.com/wp-content/uploads/sites/4/2018/09/t04-1024x432.jpg)
Without Power Reduction factor and Time Homogenisation, areas with short hatch vectors are overheated, because of the shortened cooling phase and increased exposure frequency. The process-stabilising effect of these factors can be observed from the smaller standard deviations (Parameter 2 + Power Reduction Factor / Parameter 2 + Time Homogenisation). The homogenisation of energy input achieved with these factors could be favourable in parts that have thin walls and small details and, therefore, more areas that would contain the short vectors.
The authors drew the overall conclusion that the obtained results indicated that it is possible to improve processability significantly and to reduce cracking by using optimised process parameters.
Investigation of the corrosion behaviour of 420 stainless steel processed by Laser Powder Bed Fusion
Next, a paper from Subrata Deb Nath, Harish Irrinki, Gautam Gupta and Sundar Atre (University of Louisville, USA), Martin Kearns (Sandvik Osprey Ltd., UK) and Ozkan Gulsoy (Maramara University, Turkey) investigated the corrosion behaviour of 420 stainless steel processed by Laser Powder Bed Fusion [2].
There is a high demand for the development of patient-specific surgical tools. However, customisation of tools is limited when using high-volume manufacturing processes such as investment casting and Metal Injection Moulding (MIM). In contrast, Additive Manufacturing processes such as LPBF allow the on-demand manufacture of surgical tools to customised shapes and sizes.

One of the most widely used material systems in the surgical tools industry is 420 stainless steel. Depending on carbon content and heat treatment, the ultimate strength of this martensitic stainless steel can be as high as 1800 MPa. The presence of 12% to 14% chromium in the composition confers good corrosion resistance. However, the LPBF of 420 stainless steel is not well investigated and, in fact, no data were found on the corrosion behaviour of LPBF 420 stainless steel. The reported study was therefore aimed at addressing this knowledge gap by analysing the corrosion characteristics of LPBF specimens and comparing them with wrought 420 stainless steel.
In this study, nitrogen gas atomised 420 stainless steel pre-alloyed powder, supplied by Sandvik Osprey Ltd., was used as the starting material. The chemical composition of this powder is given in Table 5. The powder had a median particle size (D50) of 28 µm and 90% of the particles were below 50 µm. The powder particles were mainly spherical in shape, with few satellite particles attached to the surfaces of the larger particles. From Table 5, the chromium and carbon contents of the powder were 12.8% and 0.3% respectively, within the range of the AISI standard.
![Table 5 Chemical composition of AISI 420 stainless steel powder [2]](http://www.metal-am.com/wp-content/uploads/sites/4/2018/09/t05-1024x154.jpg)
A Concept Laser M Lab Cusing R, fitted with a Yb-fibre laser, was used to perform the LPBF experiments. Flat type tensile specimens, as per ASTM E8 standard, with a gauge length of 35 mm, width of 6.2 mm, thickness of 3 mm and total length of 75 mm, were fabricated at an energy density of 63 J/mm3, based on choosing a layer thickness of 20 µm, a laser power of 90 W, a scan speed of 600 mm/s and a trace width of 120 µm. A continuous line strategy with alternating layers at -45°, + 45° angle was chosen as the scan pattern. The as-built tensile bars were heat treated at 315°C for 2 hours followed by air cooling.
The LPBF parts were measured to be above 99% dense, based on the Archimedes density method. The as-built LPBF parts exhibited an ultimate tensile strength of 1050 ± 25 MPa and an elongation of 2.5 ± 0.2% (Table 6). After heat treatment, ultimate tensile strength and elongation improved to 1520 ± 25 MPa and 6.3 ± 0.4% respectively. The yield strength also improved from 700 ± 15 MPa to 950 ± 20 MPa after heat treatment. The hardness of the LPBF parts was measured as 55 ± 1 HRC in the as-built condition. After heat treatment, the hardness remained similar at 53 ± 1 HRC. These values were superior to MIM 420 stainless steel properties reported in the literature: 1350 ± 50 MPa, elongation of 2 ± 1 % and hardness of 48 ± 2 HRC. For comparison, cast 420 stainless steel has a hardness of 53 ± 2 HRC in the as-quenched condition.
![Table 6 Physical and mechanical properties of LPBF 420 stainless steel [2]](http://www.metal-am.com/wp-content/uploads/sites/4/2018/09/t06-1024x166.jpg)
The etched microstructures of the as-built tensile bars, fabricated by LPBF using the D50: 28 µm powder, are shown in Fig. 6. The austenite phase appears white, whereas the martensite phase appears as gray laths or needles. After heat treatment, the parts appeared to be richer in martensite and ferrite phases. In addition, directionality in the martensite laths was observed in the scan direction. More martensite laths appeared on the edge of the scan track or the overlapping of two tracks. Further, the average distance between the laths was found to be 120 µm, equal to the trace width or distance between laser scan tracks used in this experiment.
![Fig. 6 Etched cross sectional microstructure of as-built and heat-treated LPBF 420 stainless steel in scan and build direction. Kalling agent II was used as etchant in this study [2]](http://www.metal-am.com/wp-content/uploads/sites/4/2018/09/06-1024x761.jpg)
The electrochemical corrosion behaviour of as-built and heat-treated LPBF parts was measured using potentiodynamic polarisation experiments in 3.5% NaCl solution. Linear Sweep Voltammetry (LSV) was carried out in the potential range between −600 mV and 1000 mV from Eoc at the forward scan rate of 0.01 mVs−1 with the current density limit of 10 mA.cm−2, to determine the corrosion potential (Ecorr), pitting potential (Epitt) and breakdown (Eb) potentials. Tafel plots were created from the voltage and current measurements to calculate quantitative corrosion characteristics.
The cathodic and anodic polarisation curves, obtained from the potentiodynamic polarisation experiments on as-built and heat treated 420 stainless steel fabricated by LPBF, are presented in Fig. 7. The trends in the LPBF data are similar to the corrosion behaviour with wrought stainless steels, where the regions of cathode reaction, passivation and pitting are clearly apparent. The anodic polarisation curves suggest an extremely active dissolution after the sample reaches the breakdown potential (Eb). The pitting corrosion was presumed to be preceded by uniform thinning of the hydroxide/oxide protective film that prevails over the pitting corrosion prior to the pitting potential. The as-built and heat-treated LPBF parts differ in the potential range and potential where the passivation initiated.
![Fig. 7 Potentiodynamic polarisation curves for as-built and heat-treated LPBF 420 stainless steel in aerated aqueous solution containing 3.5% NaCl. Operating condition-reference electrode: Ag/AgCl; cathode: Pt wire; pH= 6.0; scan rate: 0.01 mVs-1 [2]](http://www.metal-am.com/wp-content/uploads/sites/4/2018/09/07-1024x794.jpg)
The corrosion current (Icorr), corrosion potential (Ecorr) and cathode and anode slopes were measured using a standard extrapolation method to calculate the polarisation resistance and corrosion rate and these are tabulated in Table 7.
![Table 7 Corrosion parameters of LPBF and wrought 420 stainless steel in 3.5% NaCl solution [2]](http://www.metal-am.com/wp-content/uploads/sites/4/2018/09/t07-1024x226.jpg)
From Table 7, the as-built LPBF 420 stainless steel exhibited an Icorr of 2.85 ± 0.4 µA.cm-2, which was slightly higher than Icorr of wrought 420 stainless steel (2.1 ± 0.1 µA.cm-2). Heat-treated LPBF parts exhibited a slightly higher current density of 3.5 µA.cm-2. Icorr gives a measure of passivation; the smaller the current, the greater the passivation. The as-built and heat-treated LPBF 420 stainless steel parts exhibited polarisation resistances of 17100 ± 520 Ω.cm-2 and 16800 ± 700 Ω.cm-2 respectively, slightly lower than the wrought material properties of 18700 ± 350 Ω.cm-2. In this study, the LPBF 420 stainless steel parts showed a corrosion rate of 2.8 ± 0.2 µm/year in the as-built condition. A slightly higher value of 3.4 ± 0.5 µm/year was observed with the heat-treated parts. In comparison, wrought 420 stainless steel has been reported to have a corrosion rate of 2.3 ± 0.4 µm/year.
From Tafel plots, a corrosion potential (Ecorr) was calculated as -0.36 ± 0.03V for the as-built 420 stainless steel parts. The heat-treated LPBF parts exhibited a corrosion potential of -0.39 ± 0.02V.
The corrosion potential is determined as the potential, where the anodic reaction of metal dissolution is equal to the rate of the cathodic reaction. The breakdown potential (Eb) is determined at the inflection point value and is an indication of the stability of the passivation layer formed on the metal surface. The higher the corrosion potential, the more resistant is the passive layer. In this study, the heat-treated 420 stainless steel parts showed the highest Eb at 0.22 ± 0.01V. In comparison, the as-built 420 stainless steel experienced breakdown of the passive layer at 0.05 ± 0.02V.
It was observed that regular large pores formed on the metal surface during the corrosion tests, following the breakdown potential, indicative of pitting corrosion. No intergranular cracking corrosion was observed. No significant difference could be found between as-built and heat-treated samples. Therefore, it can be concluded that 420 stainless steel fabricated by LPBF retained its corrosion properties after heat treatment.
The quantitative difference between wrought and LPBF parts may be explained by differences in the microstructure. Also, the difference in Eb can be caused by the removal of residual stresses through heat treatment. Further X-ray diffraction and X-ray photoelectron spectrometry will be conducted on the corroded surfaces to understand the changes in chemical composition and determine if there are any mechanistic changes in the corrosion process of LPBF parts.
Extrusion based AM of water atomised 17-4 PH stainless steel powder
![Fig. 8 Heating extruder: (a) flange (b) nozzle (c) extruder assembly [3]](http://www.metal-am.com/wp-content/uploads/sites/4/2018/09/08-1024x214.jpg)
Finally, a paper from Harshal Dhamade, Nishant Hawaldar and Jing Zhang (Indiana University – Purdue University Indianapolis (IUPUI), USA) addressed the extrusion-based AM of water atomised 17-4PH stainless steel powder [3]. The extrusion-based AM (Robocasting) process extrudes a metal-based binder system, forming the desired component layer by layer. The process deposits powdered material in a slurry form and subsequently sinters the powder to create solid parts with high density.
The project team designed the extruder, to heat and extrude a slurry of water atomised 17-4 PH stainless steel powder, using SolidWorks. Taking as a reference a conventional injection moulding extruder, modifications were made to the outer diameter of the plunger. The heating extruder parts are shown in Fig. 8.
To prepare the required slurry feedstock, 55-65 vol% water atomised 17-4PH stainless steel of 45 µm particle size was mixed with a binder system consisting of paraffin wax, polyethylene, and stearic acid. The binders were mixed using a high-intensity mixer at the speed of 1200 rpm. After mixing the binders, the 17-4 PH stainless steel powder was added and mixing continued until the slurry was even. This helped in creating a bubble-free slurry consisting of stainless steel powder and binders. A range of batches with changing compositions of metal powder and binders was prepared and, after analysis of flow, viscosity and cooling rate, an optimised slurry was found, which was tested by moulding into cylinders. The various iterations in this slurry optimisation process are summarised in Table 8.
![Table 8 Slurry composition and green component property table [3]](http://www.metal-am.com/wp-content/uploads/sites/4/2018/09/t08-706x1024.jpg)
The optimised slurry was loaded into the designed heating extruder mounted on the horizontal arbor of a computer-controlled Delta printer. The temperature of the extruder was held at 100°C to maintain the viscosity of the slurry. A cylinder was selected as the print geometry, with 22 mm diameter and 20 mm height. Fig. 9 shows the AM samples. After building, the parts were kept in a furnace at 80°C for 30 min for debinding.
![Fig. 9 Additively manufactured 17-4PH stainless steel samples [3]. The logo of IUPUI is shown on the plate sample](http://www.metal-am.com/wp-content/uploads/sites/4/2018/09/09-1024x485.jpg)
Overall, it was concluded that the reported study had successfully demonstrated slurry preparation and the AM of 17-4PH stainless steel parts with the customised AM machine, incorporating the specially designed extruder. However, it was recognised that further optimisation of binder percentage in the slurry will be required in future work.
References
[1] Characterization of hard-to-weld nickel-base superalloys in Additive Manufacturing, Kristiina Kupi et al. As presented at the AMPM2018 Additive Manufacturing with Powder Metallurgy Conference, San Antonio, Texas, USA, from June 17–20, 2018, and published in the proceedings by the Metal Powder Industries Federation (MPIF).
[2] Investigation of the Corrosion Behavior of 420 Stainless Steel Processed by Laser-Powder Bed Fusion, Subrata Deb Nath et al. As presented at the AMPM2018 Additive Manufacturing with Powder Metallurgy Conference, San Antonio, Texas, USA, from June 17–20, 2018, and published in the proceedings by the Metal Powder Industries Federation (MPIF).
[3] Extrusion based 3D printing of water atomized 17-4 PH stainless steel powder, Harshal Dhamade et al. As presented at the AMPM2018 Additive Manufacturing with Powder Metallurgy Conference, San Antonio, Texas, USA, from June 17–20, 2018, and published in the proceedings by the Metal Powder Industries Federation (MPIF).
Author
Dr David Whittaker
Tel: +44 1902 338498
Email: [email protected]
Proceedings
Advances in Powder Metallurgy & Particulate Materials—2018, the proceedings of the technical sessions, poster programmes and special interest programmes (where applicable), is published in digital format by the MPIF along with selected papers from AMPM2018. These proceedings are provided to full-conference registrants free of charge or they can be purchased from the MPIF’s Publications Department.
www.mpif.org
AMPM2019
AMPM2019, the International conference on Additive Manufacturing with Powder Metallurgy, will take place from June 23–26, 2019 in Phoenix, Arizona, USA.
LAST MONTH’S MOST-READ ARTICLES