

Senvol: How machine learning is helping the U.S. Navy optimise AM process parameters and material performance
In a bid to better understand the impact of process parameters on material performance, the U.S. Navy turned to Senvol to develop data-driven machine learning software for Additive Manufacturing. As Zach Simkin and Annie Wang explain, such an approach allows the user to overcome the time and expense required by a conventional trial-and-error process, whilst delivering remarkably accurate results that have the potential to accelerate application development. [First published in Metal AM Vol. 5 No. 1, Spring 2019 | 15 minute read | View on Issuu | Download PDF]

How do process parameters impact material performance? Answering this question is one of the U.S. Navy’s main goals with respect to Additive Manufacturing. In order to provide the answer, it has previously resorted to following a difficult and time consuming process which relies on trial and error and design of experiments (DoEs). This is a common approach, and a pain point that many companies experience, but the primary drawback of trial and error and DoEs is that they are extremely expensive and time-consuming.
To be able to analyse data that had already been generated and to learn from those data, thus reducing the degree of trial and error and DoEs required, the Navy hired Senvol to develop data-driven machine learning software for Additive Manufacturing. This software will be made commercially available not just to the Navy, but to any company or organisation. This article provides a background to the data-driven approach being taken, as well as offering some of the Navy’s use cases for the software.

Data-driven machine learning approach
Machine learning is a type of Artificial Intelligence (AI) that allows a computer to perform a task (e.g., recognise a pattern, make predictions) without being explicitly programmed to do so. A computer capable of machine learning ‘learns’ to perform the task by being ‘trained’ using training data. For example, a training data set that includes information on process parameters (such as laser speed and laser power) and process signatures (such as melt pool depth) can be used to train a machine learning algorithm to predict melt pool depth based upon a given laser speed and laser power.
Senvol ML, Senvol’s machine learning software for Additive Manufacturing, takes a data-driven approach. Using this approach, the software works by modularising Additive Manufacturing data into four modules:
- Module 1
Process parameter data
(e.g., laser power, scan speed, hatch spacing) - Module 2
Process signature data
(e.g., in-situ monitoring data such as melt pool temperature or melt pool depth) - Module 3
Material property data
(e.g., microstructure, density, porosity, surface roughness) - Module 4
Mechanical performance data (e.g., tensile strength, fatigue life)
The software takes data from any one of the four modules as an input and predicts what any one of the other remaining modules should be. For example, if a user inputs a certain set of process parameters, the software can then predict what the surface roughness will be. If a user inputs a target fatigue life for a particular application, the software will determine what process parameters to use on the Additive Manufacturing machine in order to achieve this target.
Senvol’s data-driven approach is juxtaposed against the physics-based approach which is more commonly seen in the Additive Manufacturing industry today through various simulation software offerings. Senvol believes that data-driven approaches and physics-based approaches are complementary. There are pros and cons to both, and many reasons why a company might choose to use one approach over the other.
In the physics-based approach, a relationship is defined by a formula. An input is then inserted into the formula, which calculates the output. In a data-driven approach, on the other hand, the relationship between inputs and outputs is not defined by a formula. Rather, empirical data are used for both inputs and outputs and the machine learning software then infers what the relationships are.
One of the biggest benefits to a physics-based approach is that it shows causation, whereas a data-driven approach only shows correlation. Senvol chooses to take a data-driven approach, however, because doing so enables its software to analyse data from any Additive Manufacturing machine, material, or process. Physics-based models are typically specific to a particular process or material, whereas Senvol’s software does not have that limitation – it is able to analyse the appropriate data regardless of whether the process involves, for example, a metal alloy on a Laser Powder Bed Fusion (L-PBF) machine, or a polymer on a material extrusion machine.
The following sections of this article will present several specific use cases for the Senvol ML data-driven machine learning software, each of which demonstrates how an Additive Manufacturing user can reduce the cost and time required to achieve the desired end state.

Determining the correct process parameters to achieve a target material property
One common use case for the U.S. Navy is to identify the appropriate process parameters to achieve the target density for a part or component. To help solve this problem, Senvol ML was utilised.
In this case, the training data used were stainless steel 316L cubes manufactured on a Renishaw AM250 L-PBF machine, with stainless steel being a material of high interest to the Navy. Each cube was manufactured using a different parameter set, with seventy-five cubes manufactured in total. The following process parameters were varied across the cubes:
- Laser power (three variations)
- Laser dwell time (five variations)
- Point distance (five variations)
The output from the Senvol ML software (Fig. 2) shows what are referred to as ‘quality envelopes’. What the quality envelopes tell the user is that, if you want to achieve a particular density, your combination of process parameters needs to fall somewhere in the given quality envelope. Note that the specific density values were redacted for this article and are therefore referred to as ‘Density A’, ‘Density B’ and ‘Density C’.
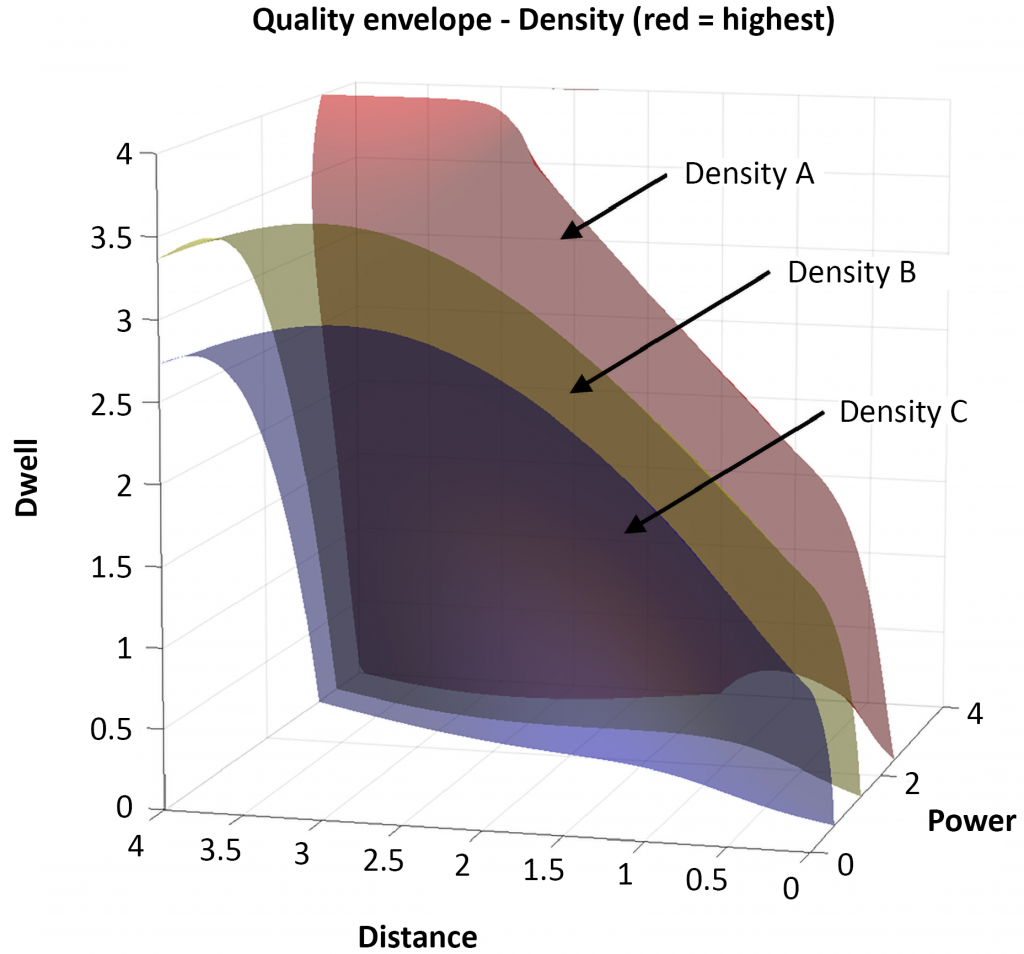
In this case, the software showed that if the Navy wanted to achieve Density A, then its combination of laser dwell time, point distance and laser power needed to fall somewhere on the red surface. Similarly, if the Navy wanted to achieve Density B, then its combination of those three process parameters needed to fall somewhere on the yellow surface.
Predicting material properties and mechanical performance from process parameters
In addition to its need to determine the correct parameters to achieve a required density, the Navy often encounters the opposite need; to predict a part’s density given the particular process parameter set that will be used in its manufacture. The training data used in this example was the same as for the previous example – stainless steel 316L cubes manufactured on a Renishaw AM250 machine.
In this particular case, there were seventy-five data points. The Senvol ML software takes a subset of those data points – in this case, sixty – and trains its algorithm on those sixty data points. The remaining fifteen data points are not seen by the software and are used for validation purposes. In other words, after the software has been trained on the sixty data points, it predicts what the remaining fifteen data points should be. The predicted values are then compared against the actual empirical values to determine how well the software predicts. In this case, an R2 (which is the coefficient of determination and measures the strength of the relationship between a model and the dependent variable) of 0.94 was achieved, which indicates that the Senvol ML software predicts very well (Fig. 3).
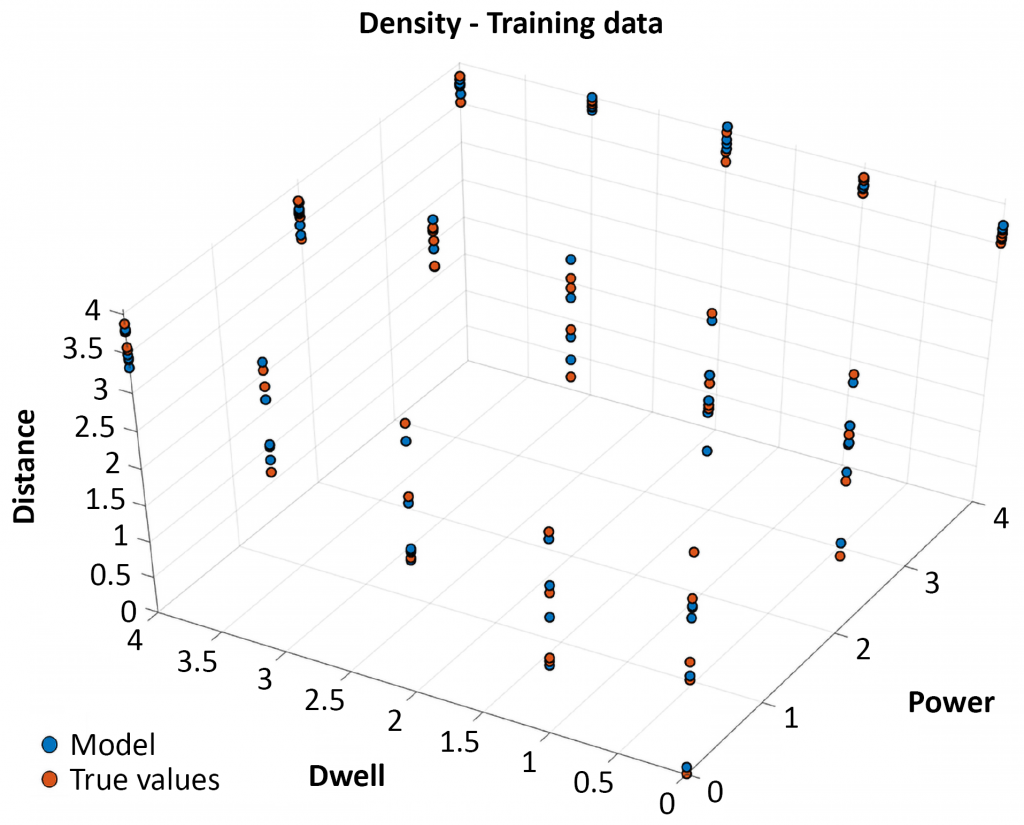
This is a particularly important example, as one of the most common misconceptions about machine learning is that tremendous amounts of data are needed in order to derive any meaningful results. That is not always the case, as demonstrated here, where Senvol ML was able to make very strong predictions with only seventy-five data points.
The Senvol ML software can be used not only for predicting material properties, but for predicting mechanical performance as well. In the following example, fatigue life was predicted based upon part orientation. In this case, the training data used were titanium Ti6Al4V (i.e., Ti64) specimens manufactured on an Arcam A2X Electron Beam Powder Bed Fusion (EB-PBF) machine. There were sixty-four specimens in total and each specimen was manufactured using one of four orientations: X, Y, Z, and XY 45°.
In this case, the software achieved an R2 of 0.86. In addition to providing an R2 value, which indicates the model’s overall performance, the Senvol ML software went into much greater detail.
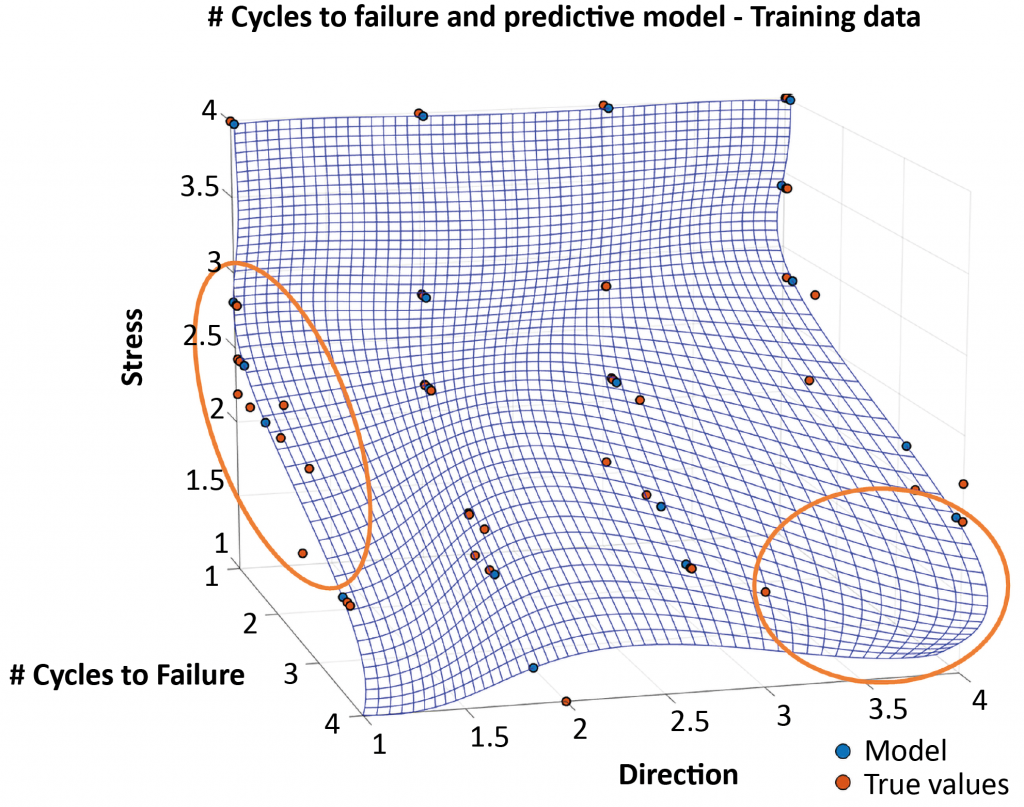
Output from the Senvol ML software (Fig. 4) shows the user which specific areas of the model are more or less reliable than other areas. The areas circled in orange are less reliable than the other areas of the model. In the orange circle on the left, this is because the data points do not fit the curve very well, which means that there is a relatively large amount of noise in the data in that particular area of the model. In the orange circle on the right, there are no empirical data at all. In cases like this, the model extrapolates on what it believes the outcome will be, but because there is no empirical data to validate the extrapolation, the prediction is considered relatively unreliable. Another way of looking at this information is on a heat map (Fig. 5).
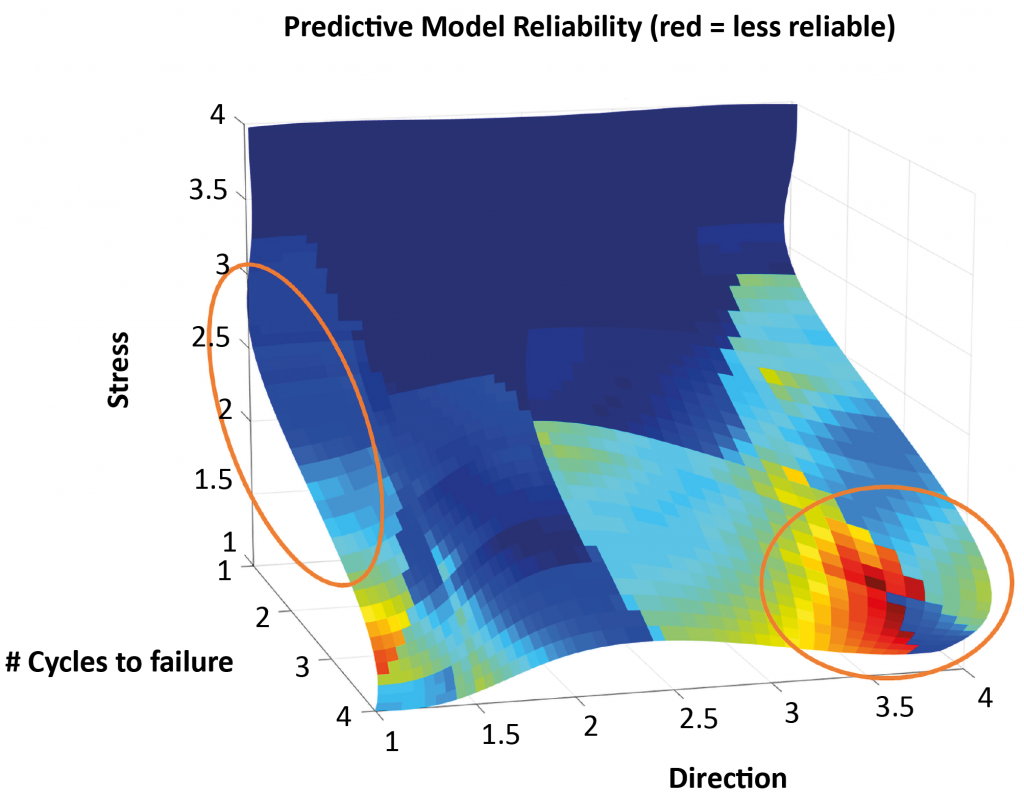
Areas shown in dark blue have relatively high reliability and areas shown in red or orange have relatively low reliability. This information enables a user to be more targeted in their data collection going forward. Senvol ML employs a capability it refers to as ‘data collection protocol’ to recommend, specifically, what the user’s next build should be. Analysing the data that have already been generated, the software determines how to be as efficient as possible in subsequent data collection efforts.
Today, most companies set up DoEs at the beginning of a project. They then complete the first build, followed by the second build, and so forth, without really modifying the plan as they go. This can often be very inefficient and costly. The Senvol ML software learns ‘as you go’, enabling users to be much more targeted and smarter in their data collection efforts. Therefore, if a user already has great predictive reliability in certain areas of the model, they need not waste time and resources generating more data in those areas. Rather, Senvol ML enables the user to focus resources on carrying out builds in areas of the model where the reliability is not as high and can be improved.
Using in-situ monitoring data to simulate non-destructive tests
The Navy would like to reduce, or perhaps even eliminate, the need for non-destructive tests. To accomplish this goal, the Navy has been using the Senvol ML software to analyse the relationships between in-situ monitoring data and X-ray Computer Tomography (CT) data.
In the following example, the training data used were stainless steel 316L specimens manufactured on a 3D Systems ProX® DMP 320 Laser Powder Bed Fusion machine. The machine that was used is located at Pennsylvania State University, which is Senvol’s academic partner on its Phase II STTR with the Office of Naval Research (ONR). Each specimen was manufactured using one of thirteen different parameter sets and there were 117 specimens in total. Three process parameters were varied across the 117 specimens: laser power (five variations), scan speed (five variations), and hatch spacing (five variations).
The ProX DMP 320 is equipped with 3D Systems’ DMP Monitoring, which incorporates two different in-situ monitoring systems, DMP Vision and DMP Meltpool. Jared Blecher, an engineer in 3D Systems’ Advanced Development Group, explains, “We integrated a high-resolution camera into DMP Vision to record images at each layer of the build surface, both before and after recoating. Then we supplemented these data with information gathered from the DMP Meltpool system, which is comprised of two off-axis photodiode sensors and collects data on the light intensity emitted from the build surface. Collectively these two streams of data provide a full picture of the build’s characteristics.”
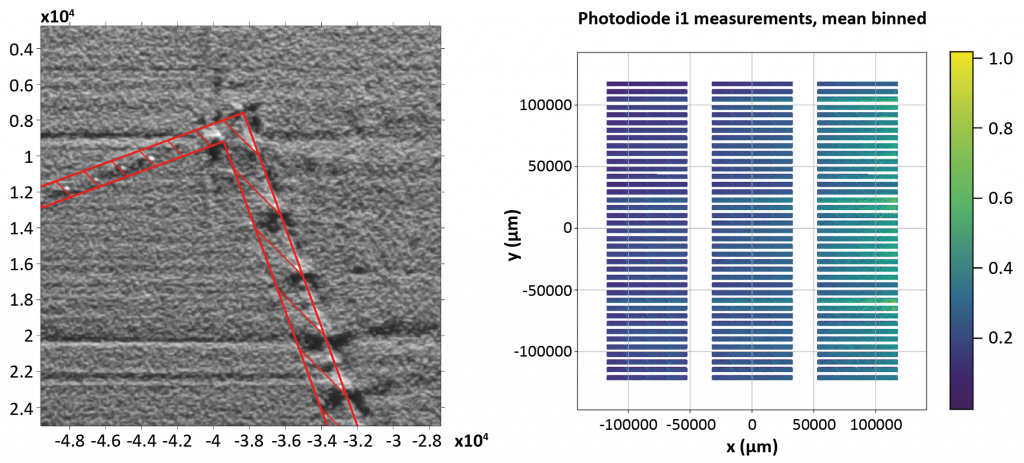
The Senvol ML software is equipped with computer vision algorithms that analyse in-situ monitoring data in real time. In Fig. 6 (left), Senvol ML’s computer vision algorithm analyses high-resolution photographs of the build surface (from DMP Vision) to locate what it refers to as ‘optical irregularities’, such as hills, streaks or valleys. Similarly, in Fig. 6 (right), the algorithm locates ‘photodiode irregularities’ in the photodiode data (from DMP Meltpool).

Senvol’s software also includes a computer vision algorithm that automatically detects defects in X-ray CT scans. These defects show up as dark spots (e.g., a pore) in an otherwise light-coloured area (e.g., solid part). For each voxel, the Senvol ML software looks at what happened in the preceding layers and learns the relationship between observed patterns and defect formation (or not).
In Fig. 7, the top image shows raw data from an X-ray CT scan, with a defect (identified by a human) circled in red. The bottom left image shows the output from Senvol ML’s computer vision algorithm, which automatically detected the defect in the X-ray CT scan (circled in red again).
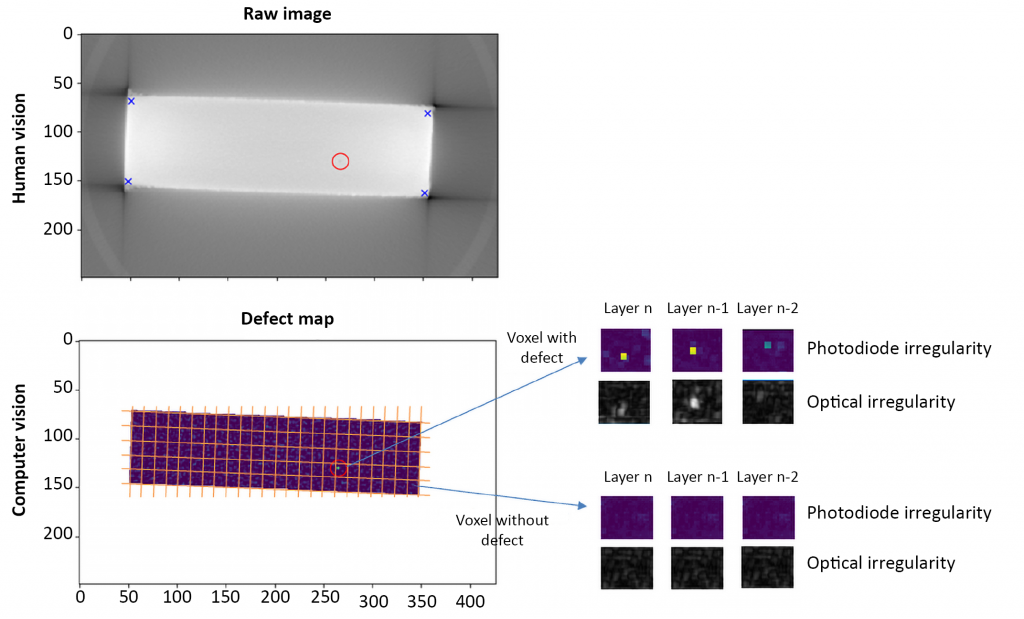
To illustrate how the software works, a grid (orange) is overlaid on top of the image to divide it into voxels. The computer vision algorithm determines which voxels contain a defect and which voxels contain no defects (note: the grid is not to scale and is simply meant for illustrative purposes). The Navy intends to use this analysis to predict whether or not a defect will be observed in a given voxel based on the pattern of irregularities observed in the in-situ monitoring data. Over time, as the Navy trains the software with in-situ monitoring data, the software’s predictions will be able to reduce, or possibly even eliminate, the need to use X-ray CT.
Allison Beese, Assistant Professor of Materials Science and Engineering and Mechanical Engineering at The Pennsylvania State University, and the school’s Principal Investigator on its work for Senvol’s STTR with the Navy, explained, “X-ray CT scans are relatively expensive to produce. By learning the relationships between in-situ monitoring data and X-ray CT scan data, the Navy may be able to reduce the amount of X-ray CT scanning that it does, which could lead to potentially significant cost savings.”
Predicting mechanical performance from in-situ monitoring data
Another use case of the Navy’s is to predict mechanical performance from in-situ monitoring data. In one example, the Navy has tried to predict tensile strength. The training data used in this example was the same as for the previous example (stainless steel 316L specimens manufactured on a 3D Systems ProX DMP 320 machine).
The Senvol ML software analysed the in-situ monitoring data and showed the marginal contribution of each variable (see Table 1). In this case, there are four total photodiode irregularity variables (two features for each of the two photodiodes) and one optical irregularity variable.
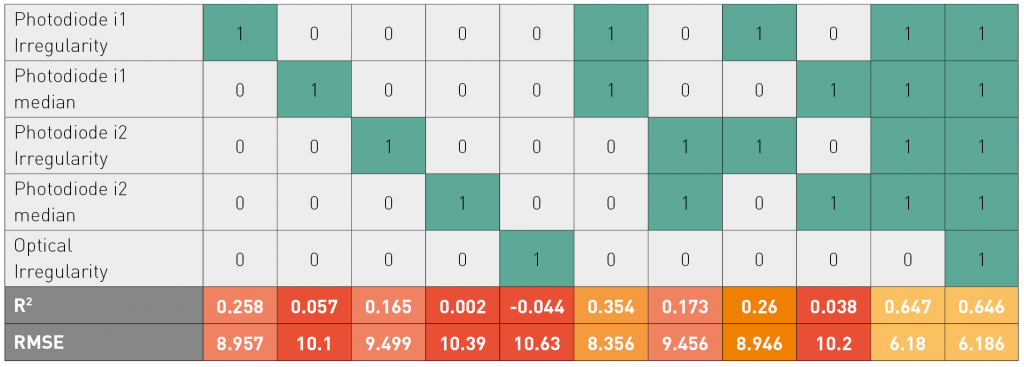
Of particular note is that an R2 of 0.65 was achieved using only the photodiode data (see second to last column on the right). When also including the optical irregularity variable (from the high-resolution photographs of the build surface), the R2 remained at 0.65 (see last column on the right).
This highlights two interesting developments within Senvol ML. Firstly, the fact that the software was able to predict tensile strength with an R2 of 0.65 based only on the photodiode data is surprising and positive. 0.65 is, in itself, not a particularly high R2; however, when it is considered that the analysis was based on data from only one sensor type and from only one build, this is quite remarkable. It can be presumed that as more data is fed into the software, the accuracy of the predictions will continue to increase.
Secondly, in this case the high-resolution photo data were not helpful in predicting tensile strength. This is not to say that high-resolution photo data is never helpful in predicting tensile strength, but for this data set, that was the case. Senvol has some hypotheses as to why that may be the case and is currently investigating further.
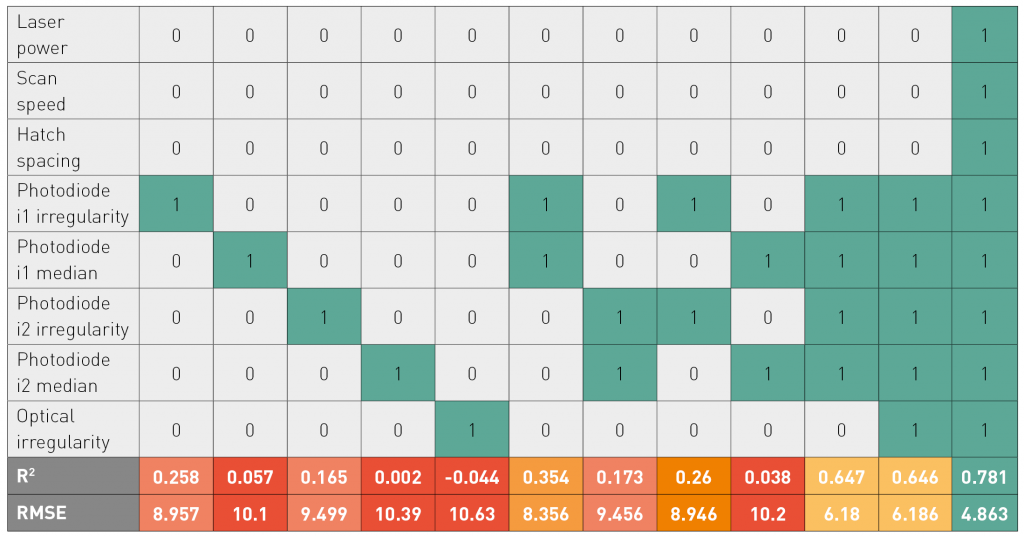
In-situ monitoring data may not need to be analysed in isolation. Table 2 shows the results when the in-situ monitoring data and process parameter data were analysed together. When including the process parameter data, the R2 increased from 0.65 to 0.78.
Learning from previous data and transferring that learning to new AM machines and materials
When the Navy, or indeed any organisation, qualifies an Additive Manufacturing machine, it needs to generate a certain amount of data to do so. This is typically a substantial and expensive undertaking. What happens, though, if the machine gets a software update, which may or may not make changes to the machine that the organisation is not aware of? Does the organisation need to regenerate the same amount of data in order to requalify the machine?
Using Senvol ML, the answer is no. Transfer learning is a concept that enables a user to transfer some of the learnings from a particular machine and material combination to a new, or unseen, machine and material combination. For example, let’s say a company has been using a particular alloy on an EOS machine and has generated a large body of data. If it then purchases a Concept Laser machine to run the same alloy, it does not need to start from scratch. Using Senvol ML’s transfer learning capability, it is possible to apply some of the learnings that it already has from the data on the EOS machine to the Concept Laser machine. This speeds up development cycles and helps companies to reduce the amount of money that they need to spend generating data.
Vision
Many companies and organisations have multiple sites with a range of different Additive Manufacturing machines. This is true for the Navy as well as for many manufacturing companies. Senvol’s vision for its Senvol ML software is that an organisation will have one instance of the software such that the various sites and Additive Manufacturing machines within it are all contributing data to the software. As more data is generated across the organisation, the Senvol ML software will continually improve and the predictive reliability will continue to become more accurate. This is particularly beneficial because it will mean that everyone across an organisation will benefit from their colleagues’ data, regardless of whether or not they are located at the same site.
Additional work
Senvol’s use of its Senvol ML software is not confined to the Navy. The company also has projects underway with Oak Ridge National Laboratory (ORNL), the Defense Logistics Agency (DLA) and the National Institute of Standards and Technology (NIST). Additionally, it is currently running an Alpha programme with a select group of companies that have been provided early access to the Senvol ML software’s capabilities. Any company or organisation interested in joining the Alpha programme is encouraged to contact Senvol directly.
Contact
Zach Simkin
President
Senvol
335 Madison Ave, 16th Fl
New York
NY 10017-4611
USA
LAST MONTH’S MOST-READ ARTICLES