

Facing obstacles to profitability in metal AM: An Operational Excellence perspective
Just as Design for AM demands an entirely new mindset to be truly effective, understanding efficient AM machine utilisation in order to drive profitability also requires a major shift from conventional practices. In this article, Magnitude Innovations Inc’s Matt Tusz, Founder and CEO, and Caterina Pampolari, Business Development Manager, explore operational and financial losses in metal Additive Manufacturing. They offer advice on how to overcome these growth barriers through production efficiency and profitable pricing strategies, with a focus on Operational Excellence and Continuous Improvement. [First published in Metal AM Vol. 6 No. 2, Summer 2020 | 15 minute read | View on Issuu | Download PDF]

Metal Additive Manufacturing finds itself between a rock and a hard place: on the one hand, the pricing of AM services comes down to machine productivity, based on a company’s go-to-market strategy; on the other, we need to consider the competitive landscape of the industry and how the pricing of services is influenced by competitors. However, unlike traditional manufacturing, determining the correct pricing strategy for metal AM is complex and inconsistent between projects. With time, manufacturers find themselves with losses of over 50% of their manufacturing capacity, and that is not good for the industry.
In this article, we will explain why this dynamic in particular hinders the growth of the metal AM industry, why it’s in our collective interest to address it, and how to double the revenues from these systems without additional capital investments.
How did we get to this point?
For an understanding of how this has come about, it is useful to look at the history of pricing in manufacturing. During the evolution of manufacturing, machines could not be digitally programmed, therefore we needed to analyse the contribution of machine utilisation through a Machine Hourly Rate (MHR) serving as a proxy for productivity.
This was effective: since traditional system productivity is high, variations between jobs are insignificant and the margins are considerable. With that simplification, the most important aspect of machine utilisation is considered by determining system uptime. In the case of AM, this approach was adopted early on, since it was commonly understood as a ‘decent’ rule-of-thumb approach. However, unlike traditional methods, AM had many factors that made it difficult to implement.
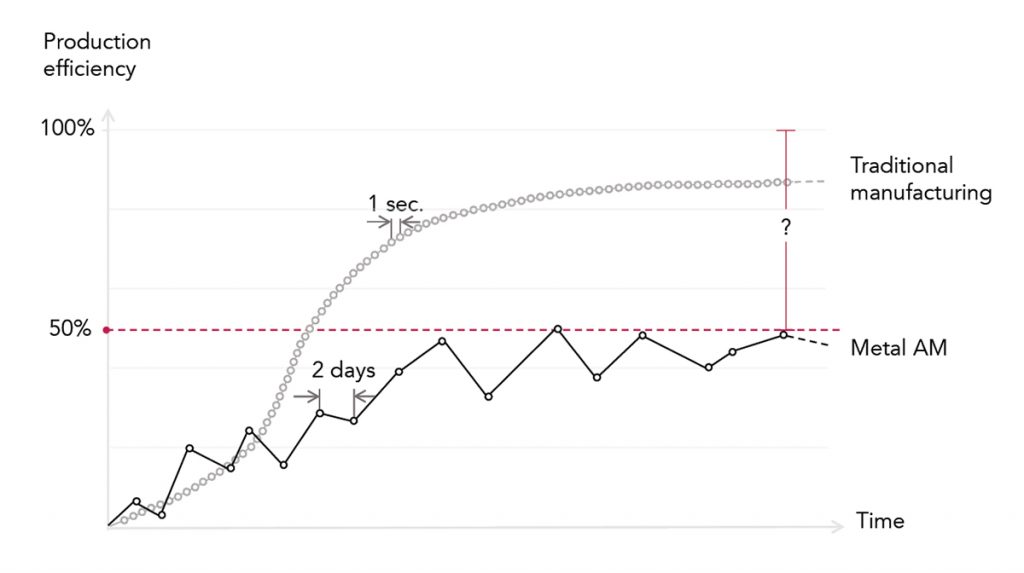
To begin with, additive process steps take days to execute instead of mere hours, and vary significantly between different machines, materials and even production runs. Next, with the CAM software from machine manufacturers being, in essence, a black box of proprietary algorithms, it is impossible to determine what could be done to improve the process. Adding to this, a single project can take weeks to deliver and is mixed with other production parts. All this leads to an inevitable conclusion: accounting principles cannot be used to reveal the enormous losses in efficiency occurring on a daily basis. Complicating things further, there is a fundamental gap in the manufacturing industry’s knowledge of AM machines beyond prototyping; hence, factors such as scrap rate and production efficiency are typically ignored after the initial business case is made. Since the technology is still evolving by leaps and bounds, the rate of change in metal AM machines is making this problem more acute for manufacturers to track and price.
Where are we now?
As the demand for production components has become a legitimate possibility, these questions began to enter discussions within AM projects, but it was tough to step out of the approach ingrained in our common consciousness; namely, that we don’t charge for parts based on system efficiency directly, but rather use an hourly rate as a proxy. Unfortunately for manufacturers, these efficiency losses are significant; in the best case, they consume an organisation’s complete profit margins, and in the worst case, they amount to over 50% of machine capacity.

In order to maximise the quality and profitability of AM machines, Magnitude developed the software solution Uptimo to quantify AM production performance down to the voxel and use this information with the help of predictive performance analytics to automate the decision making process in the production chain. With machine learning and empirical results, Uptimo anticipates failures before they occur in order to deliver higher profit margins, regard-less of what is being manufactured. Based on our expertise, here we share the first level efficiency gains that any organisation can obtain to increase profit margins while improving productivity and production quality.
Why aren’t we measuring efficiency properly?
For the most part, traditional manufacturing efficiency has relied on Operational Excellence metrics in order to quantify the efficiency of any production process. Through the use of Overall Equipment Effectiveness (OEE), we can quantify the productivity of a system and use that to adjust the pricing that we offer for services rendered. OEE lends itself elegantly to any manufacturing process because we can break down the problem into three simple measurements: uptime, speed and quality of product, all measured out of 100%, through what we refer to as Availability, Performance and Quality. Multiplying these values then gives us the production efficiency.

This method, however, is not effective when running a metal AM system, specifically because of how the metrics are determined and the opposing focus of manufacturers. For metal AM projects, each build that is run on a system tends to be different, meaning differing build times, build parameters and output success. Additionally, since each metric is determined from different dimensions (e.g. time, build rate, volume), each material has different speeds, and the success of the output is process- and application-dependent, it is practically impossible to determine OEE.
As an alternative, years of development have resulted in an equivalent metric, the Additive Manufacturing Index (AMI), which is a combined value calculated from Planning, Parameters and Parts in order to address the shortcomings of OEE, take into consideration the complexity of metal AM and help manufacturers reduce costs and improve productivity. The AMI has become instrumental in work to free up capacity, improve profitability and lower the Cost-Per-Part (CPP) so as to bring metal AM into an area of profitable growth for manufacturers and end-users alike.
Why system efficiency matters
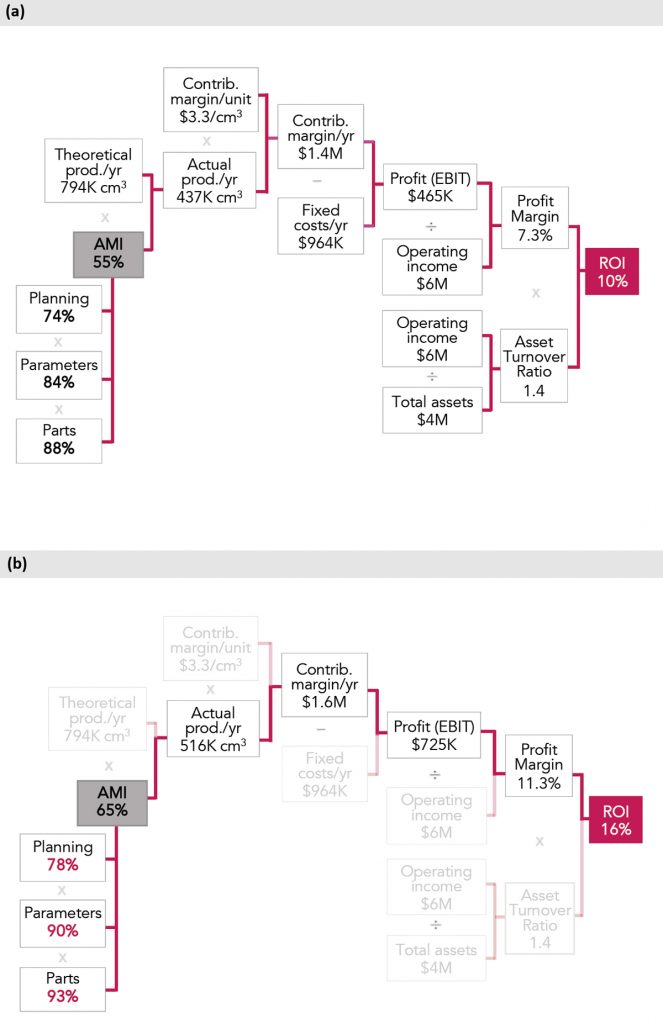
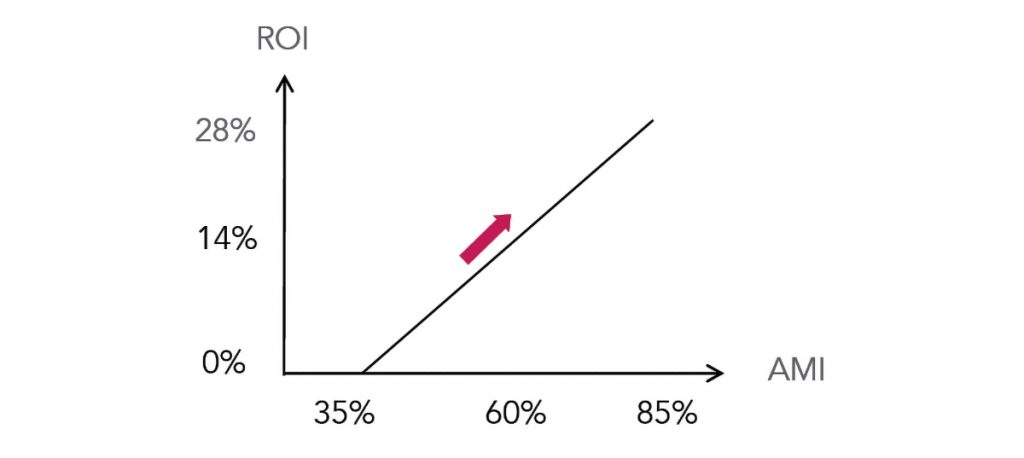
When using AMI, we have discovered that typical metal AM system efficiency is operating at a range of between 35–45% (Fig. 2). This means that productivity across the industry can be doubled by simply utilising the available systems more effectively. At these rates, as determined by a DuPont analysis, manufacturers are at the limits of profitability with an ROI of 1–2% per year when system efficiency is between 35–40% (Fig. 3a). Furthermore, with every increase in average AMI of 10%, the ROI improves by 6% (Fig. 3b). With a granulated analysis and help from our efficiency metrics, we can determine which applications, materials and machines are profitable, adjust the pricing strategy, and utilise data to drive corrective actions.
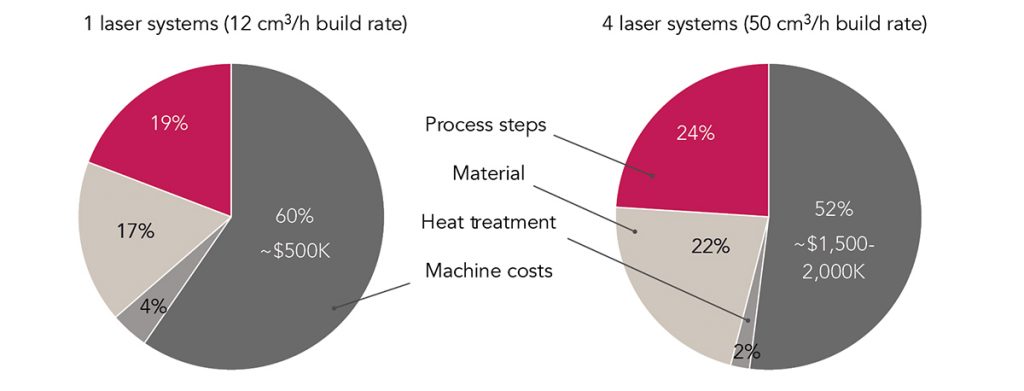
From the end-user perspective, the most important factor is the CPP, which is disproportionately dependent on system amortisation. We observe that approximately half the CPP is due to this factor alone, excluding quality control (QC) measures (Fig. 5). This means that the resultant CPP is mostly affected by a lack of machine efficiency, which can be either offset by cheaper machines or higher productivity. In comparison to powder costs, the price sensitivity of individual parts is 2.5x more affected by machine utilisation. Considering that machines are utilised at an AMI of 40%, the CPP can be reduced by 25% from efficiency gains in comparison with savings of 2–4% based on cheaper powder, not including the fact that new powder sources have to undergo costly validation tests and are available to everyone, therefore failing to deliver any competitive advantage.
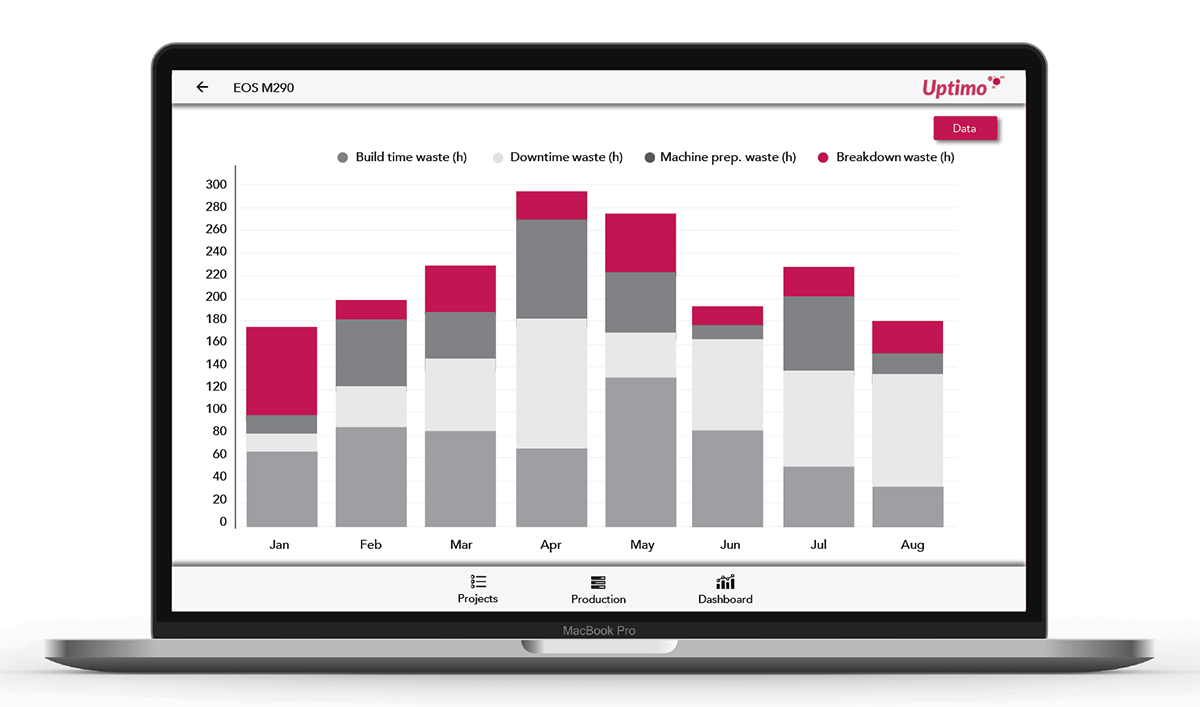
Known unknowns: Invisible production wastes
As previously mentioned, the efficiency of AM machines is not easy to determine. Not only is each project different, making the calculations time-consuming, but there is invisible waste that is difficult to determine in a production environment. At Magnitude, we break down the wastes from a production into four interconnected categories:
- System downtime: Planning metric
- Parameter inefficiency: Parameters metric
- Rejected parts: Parts metric
- Breakdowns: A combination of system downtime and rejected parts
With this segmentation, we can effectively see how these losses are interconnected through a typical example:
A machine is running a project that is thirty hours long. The machine starts at 12:00 PM on Monday and continues until 6:00 PM on Tuesday. The shift in the factory comes to an end on Tuesday and the machine is not running from 6:00 PM Tuesday until 8:00 AM on Wednesday. At this point, the approach is typically either “we can’t do anything about it, let’s wait until the next day,” or someone has to stay late at nights to start the next production. This results in a downtime reflected by a Planning metric of 68% (Fig. 6a). Assuming that the parameters and parts efficiency is perfect, the AMI is 68 x 100 x 100 = 68%. However, a quick analysis reveals that the parameters used were only 80% efficient, meaning that the build required thirty hours, but could actually have been completed in twenty-four hours (Fig. 6b). From this, we realise the true AMI is actually 68 x 80 x 100 = 54%. If, on the other hand, we would have optimised the parameters, we could have shortened the build time by two hours, which would have been enough to start another project on Tuesday afternoon and not wait until Wednesday morning (Fig. 6c). This would have improved the Planning and Parameters metric to 100% and 85%, resulting in an AMI of 85%.
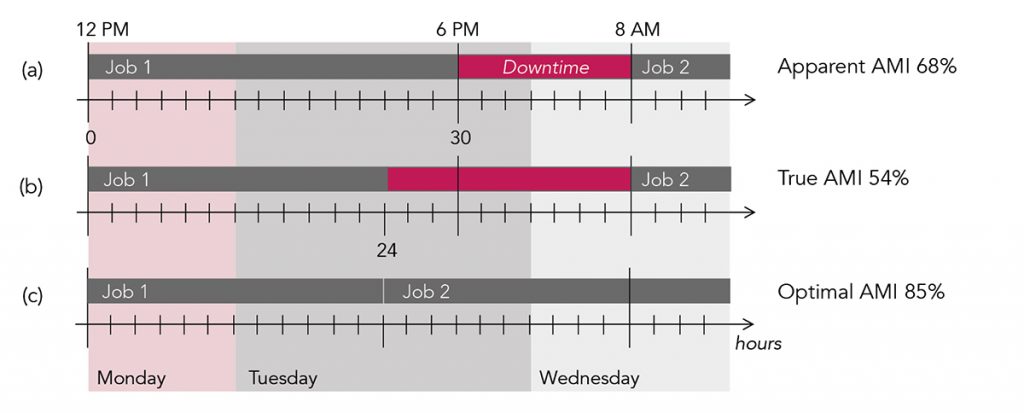
In the end, we have three efficiency values: the perception is that the system for this project is running at 68% efficiency, and there was nothing we could have done to optimise the production. In fact, the system is running at 54% efficiency and we could have saved six hours of production time. Finally, if we optimised our scheduling as well as the parameters, the nominal build would have resulted in an efficiency of 85%, and no member of the group would need to work overtime. These kinds of losses are what we call ‘invisible wastes’, and occur on a daily basis in metal AM. In this case, this is an invisible waste that only appears when we analyse the Planning in conjunction with the Parameters metric of the job.
More importantly for the organisation, these wastes suffer from poor metrics that appear to show that everything is optimised, nothing can be done and the system efficiency is reflected within the pricing strategy. Unfortunately, since we have not properly quantified these losses, it is impossible to address them in the company strategy or operations.
Invisible losses in process speed
On a commercial level, we incur invisible losses every time a ‘qualified’ process is utilised. For technical reasons beyond the scope of this article, when a project is built with slower-than-possible parameters, users tend to notice a jump in build time that results in additional manufacturing hours. This is inherently what the end-user has to pay for in terms of their components. What we do not see in such an instance are the inherent efficiency losses in terms of opportunity cost. What this also shows is that manufacturer and end-user goals are at first glance conflicting: longer durations mean higher revenue, but a lack of metrics does not reveal lower profit margins.
For an example, we need to go no further than to expand on a theoretical serial production. Let us say that a 30 µm layer titanium process parameter has been qualified and selected for our production. If built in 60 µm, the parameters could build the geometry in eighteen hours when optimised and twenty-two hours with ‘default’ manufacturer parameters with no effect on final part quality. With the 30 µm qualified parameters, this job is built in forty hours. On the face of it, it would appear that it is a win-win situation for both the supplier and end-user; the manufacturer is now able to charge for more machine utilisation and the end-user does not need to spend additional resources on qualifying the 60 µm process. However, the resultant parameter efficiency is merely 45%, revealing that revenue is decoupled from the profitability of the project in a significant way.
Assuming the Planning and Parts metrics are perfect, we observe that the highest AMI achievable is 45% and the opportunity cost is over 50% of the machine capacity. Extrapolating this for an entire year’s worth of production, we can safely deduce that the best-case scenario AMI will be 45%, resulting in enormous underutilisation. As you can imagine, this problem is further compounded when we utilise these systems in a variable production.
Typically in these situations, we observe that manufacturers tend to keep busy in order to fully utilise machine uptime without defining what their organisation represents. In the early stages of learning by doing, this is understandable. However, as organisational experience and competence mature, these projects should be scaled down and a manufacturing specialisation developed. Suppliers at this stage have a difficult, but absolutely necessary need to change their mindset, either by charging for the lost opportunity cost to make up for 100% system efficiency in the short term, by improving the CPP through cheaper systems and part redesign, or by simply refusing such business in order to focus on a more profitable niche.
Invisible output losses
The final invisible waste category that we continuously notice with customers is the challenge in identifying the opportunity cost related to machine output. Every time a part or batch is rejected due to non-conformities, these losses are not quantified, since scrap rates are difficult to track in a variable production. Because AM offers the ability to customise every product, we see that rejected product costs are difficult to compare with the true costs of other efficiency losses like machine downtime or parameter inefficiency. Without holistic metrics, these wastes are ignored and not accounted for in terms of overall production efficiency.
The approach with rejection waste is similar to downtime and parameter inefficiencies, in that we compare the losses from rejected parts and try to strike a balance with other metrics. Slowing down the process is typically effective in reducing these rejections and leads to better overall AMI. After all, if a system is running at maximum capacity, but the output is of no value to the end-user, it is the same thing as not manufacturing anything in the first place. What needs to be considered here are the two major reasons for these losses: first rejections are a result of the steep learning curve in utilising this technology, while the remainder of rejections are related to process limitations connected with specific geometries, materials and machines.
How do we systematise our work?
Coming back to the bigger picture, companies are missing a systematic approach to solving these problems within their organisational structure. To address this, they need to convey to individual team members the quality that their production represents and have a systematic approach to solving these issues. These guiding principles need to be written in a simple structure that encompasses every production variability so that the whole organisation can participate. As organisations define this structure, they tend to struggle with conveying to individuals the process because of gaps in terms of metrics as well as specific problems that arise. If individuals feel that their concerns are not included in the corrective strategy discussion, the acceptance of such practices is mostly ignored, at which point the only solution is non-flexible rules within the manufacturing process. This results in additional invisible losses.
What we propose to a general problem-solving schematic is to divide all of the issues in production into three categories and then systematically solve them. Through this approach and with metrics that keep track of all process shortcomings, we can convey to individuals the importance of their tasks in the larger picture of the value chain.
To begin with, organisations need to be open about their approach and goals. With goals, we refer to the simple focus of output, profitability and strategy and their alignment with individual incentives. If these are communicated correctly, team members will be forthcoming with issues in production, because it will eliminate the ‘us vs them’ mentality in an organisation. If done incorrectly, this appears on the shop floor as a competition between individual production steps, which leads to a dynamic of blaming others for shortcomings without ensuring overall team success.
Next, the corrective actions need to be prioritised in order of significance to the whole organisation. This involves holding regular review meetings with the team and prioritising losses through metrics that are easy to understand. Once these losses are quantified, we segment them into categories according to whether they can be eliminated, minimised, or, in the event that they are unavoidable, allocated as the true cost of an individual project (Fig. 7).
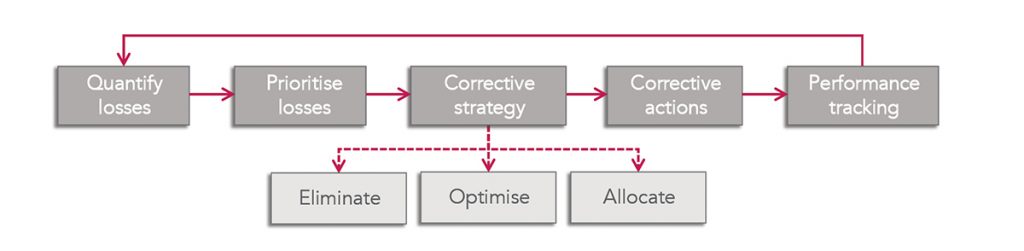
Within each of these categories, the team needs to be involved to determine the best way to proceed, first eliminating the largest losses, then minimising the losses that cannot be completely removed and ensuring that true costs are reflected in the price of services rendered. Going forward, we need to keep track of the overall performance as we move through this exercise by tracking improvements and exchanging on best practices observed.
In illuminating these invisible wastes, AM performance can be improved to an extent that was not previously possible. With metrics enabling total production oversight, we can automate the AM decision process and lower the CPP in order to improve quality and reduce costs throughout the AM value chain. Due to the high sensitivity of AM process efficiency, only predictive analytics can help users of the technology to fully utilise their systems and result in long-term profitability. As shown earlier by the DuPont model in Fig. 3, every 10% improvement in average efficiency results in a 6% increase in ROI for a production system, implying that total investment costs can be recuperated five years earlier, or a business case for a larger space of applications can be developed.
Even though this first level optimisation can be performed manually, only automated solutions such as Uptimo can deliver a holistic approach to loss reduction. With Uptimo, we can quantify all of the losses in production and execute and track the impact of corrective actions in order to ensure the highest possible efficiency gains over time. Additionally, Uptimo does not lead to lost time on the manual effort required to determine true efficiency losses as well as the coordination of corrective actions. In comparison with Manufacturing Execution Systems (MES), these methods consider the efficiencies of the whole production chain and lead to precise prioritisation of corrective actions.
In the end, organisations can tackle these challenges through good metrics, systematic corrective actions, correct pricing and by fulfilling a niche in the industry. Based on our experience, only with a holistic approach to tracking and solving these problems will organisations achieve true OpEx and deliver on the promise of Industry 4.0.
Authors
Maciej Tusz
Founder and CEO
[email protected]
Caterina Pampolari
Business Development Manager
[email protected]
Magnitude Innovations Inc.
www.magnitude.am
LAST MONTH’S MOST-READ ARTICLES