

Volume Graphics helps evaluate product quality from CT and other NDT technologies
Volume Graphics GmbH, headquartered in Heidelberg, Germany, has released the latest version of its software suite developed to help users collaborate and evaluate product quality from CT and other Non-Destructive Testing (NDT) technologies.
The widespread digitisation of manufacturing is enabling companies to make products faster. As a result the physical inspection of finished goods, based on CT and other industrial product-scanning technologies, has taken on even more importance, explains Volume Graphics. As the digital product-development pathway has become increasingly sophisticated, simple scan-data-based, quality-assurance software may be key to its successful application in aerospace, automotive, electronic, medical, and other industries.

The newest release of Volume Graphics’ advanced non-destructive evaluation software suite is intended as a response to this ease-of-use need. It features enhanced data-interpretation, collaboration and presentation capabilities, enabling users to more easily refine, integrate and share their product-manufacturing-quality results and initiatives.
The underlying architecture of the suite (which includes VGSTUDIO MAX, VGSTUDIO, VGMETROLOGY, VGinLINE, and myVGL) harnesses algorithms developed over decades, incorporates greater automation, and now includes customised deep-learning tools. The latest updates enable even the non-expert user to quickly and effectively apply these powerful resources to quality evaluation throughout the product lifecycle – and collaborate with its experts in a common language.
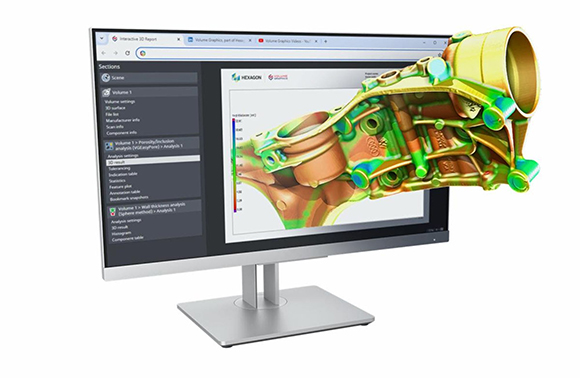
Interactive reports and PNG format for easier sharing
Sharing scan data results and reports is a vital part of moving a manufacturing organisation forward on the journey towards optimal product quality. Reporting needs to flow from engineers to managers – who may not have run any analyses themselves but want to understand when and/or where a particular pore or crack occurred and why an accept or reject call was made or a design change implemented. New in 2024.1 is a HTML report functionality that supports 3D interactive part or result views. Self-contained documents are now accessible with any Chromium-based browser like Edge or Chrome, so that analyses can be interactively viewed at any stage of the quality-assurance process
Along with this, a new user-requested PNG export functionality is available. When using PNG as a storage or data-exchange format, all images produced by Volume Graphics analyses can now be copied and pasted directly into almost any kind of media without the need for additional file conversions. This change provides for more powerful visualisations, reports and presentations – and a faster workflow for importing or exporting volume data.
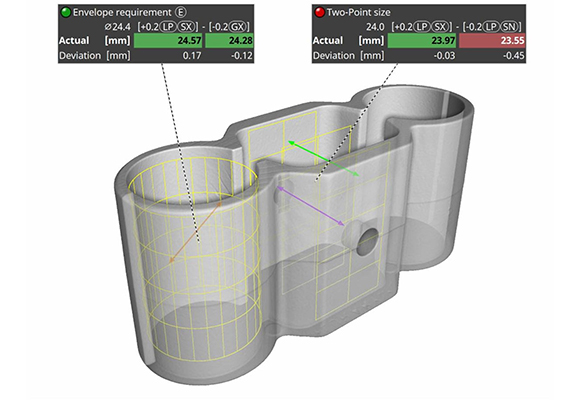
Linear sizes for metrology
Linear functionality is valuable for users concerned with geometric dimensioning and tolerancing (GD&T). The common abbreviations used to indicate linear sizes are now visually represented directly within report graphics. This simplifies standard conform measurements by providing direct support for modifier symbols – and enables easier evaluations for many size features such as two-point measurements (LP), envelope requirement €, and global modifier symbols like (GG).
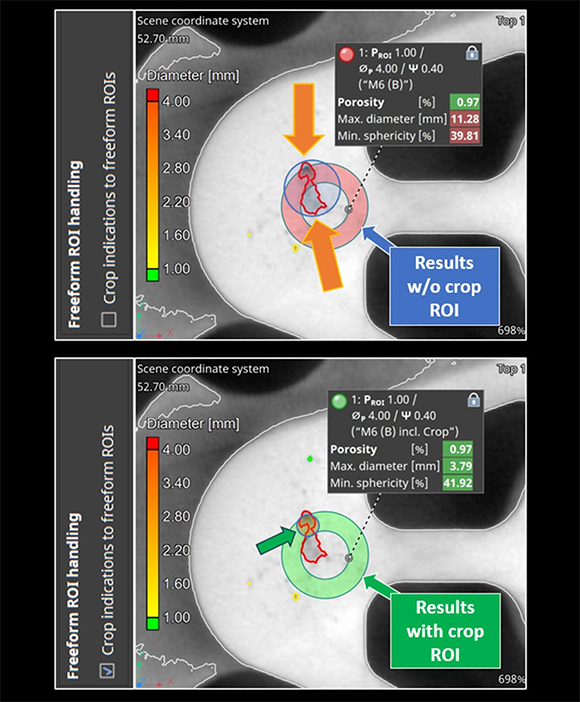
PIA updates – of particular interest to the casting industry
Updates in Volume Graphics’ porosity inclusion analysis (PIA) capabilities make it easier for casters to meet industry-compliance requirements P 202 and P 203. Multiple regions of interest can be evaluated to determine whether they are in tolerance, or not – with instant, colour-coded viewing of tolerance states.